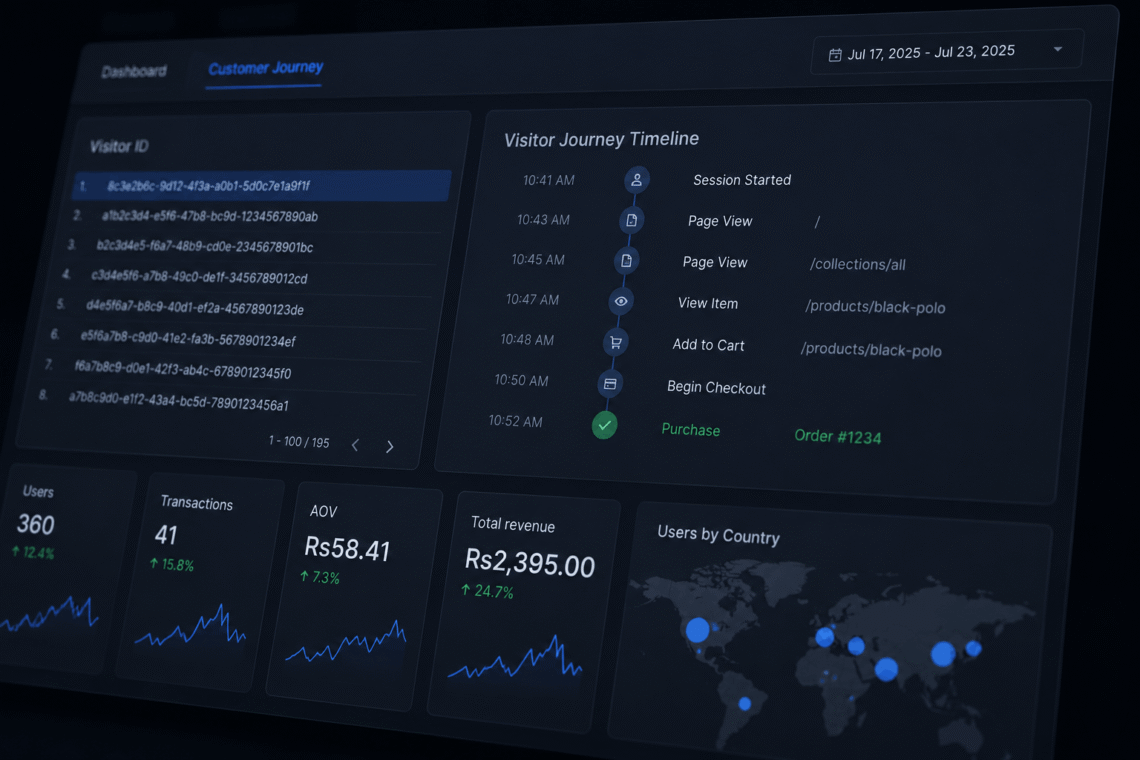
In my previous article, I explained how I implemented browser-side and server-side tracking for a Shopify store using Google Tag Manager, GA4, and Meta CAPI. Once it was done, the next step was making that data useful. This article covers the dashboards I built in Looker Studio/Data Studio using BigQuery as the data source.
I came up with two screens:
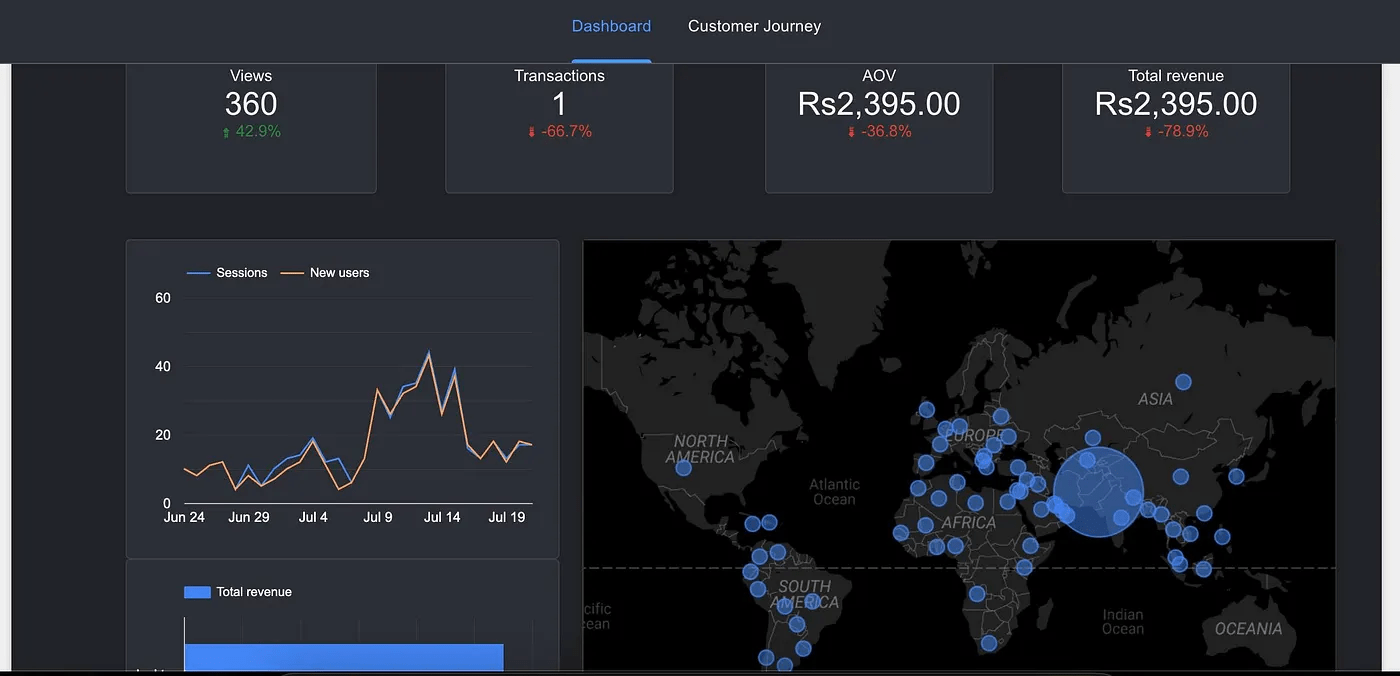
- Executive Dashboard: Having typical metrics: Views, Transactions, Average Order Value, etc. Something you might have seen hundreds of times.
- Customer Journey Explorer: It lets you select a certain visitor and find out what activities he has performed within the date range. This makes it much simpler to track how one particular customer behaved inside the store prior to buying or walking out without purchasing. Rather than analyzing overall report figures, you get to see the behavior of just one customer.
Customer Journey Report is something I want to discuss here because it shows that sending out a unique visitor ID can help you to track all activities of a visitor.
Implementation
I wanted to come up with a screen having two tables: a list of all visitor IDs and a table showing all events in the 2nd table if a certain visitor is selected in the first table.
In order to do this, I opted for BigQuery because it was easier to implement. I created a Google Project with the APIs enabled for GA4 and linked it with the GA4 account. It takes 24 hours for the GA4 data to be available on BigQuery, so I had to wait for a few days. The result:
The first table shows the list of all visitorIDs. The same visitorIDs that were generated at the Shopify end and propagated both in GA4 and Meta via Google Tag Manager.
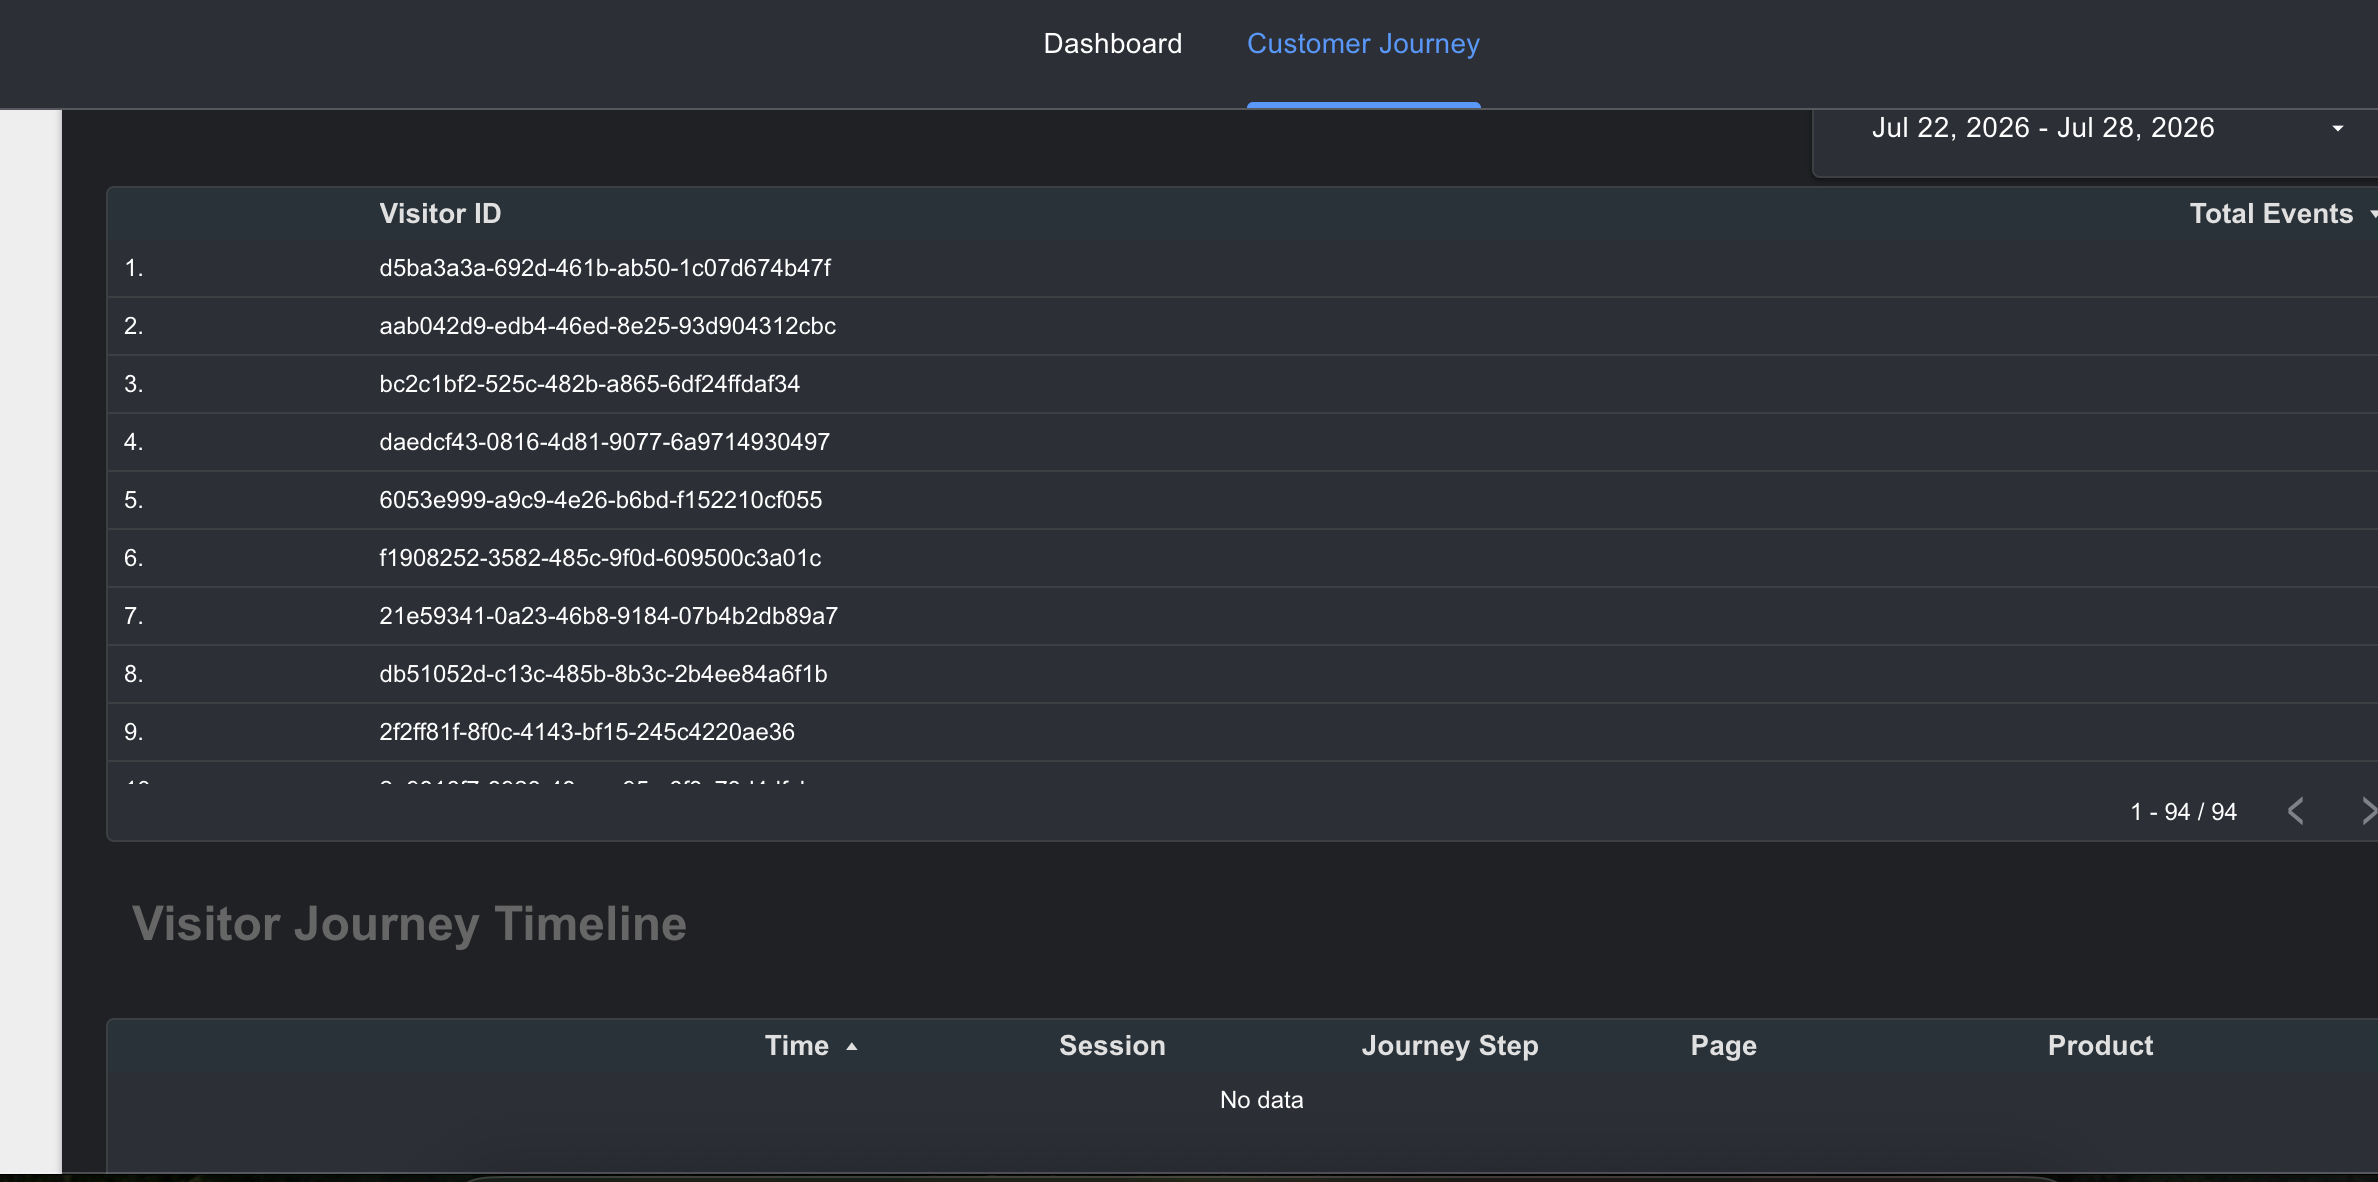
Selecting a visitor automatically filters the timeline below, making it easy to inspect that visitor’s complete journey.
And if you select one of them, it shows the entire activity of the visitor within the time range:
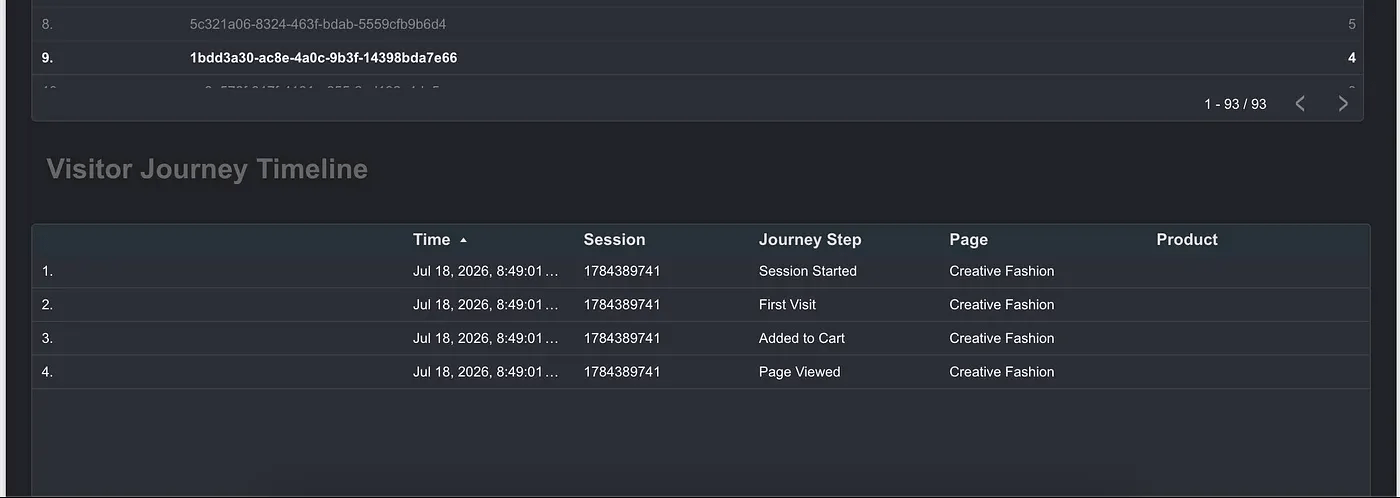
As you can see, it gives you an idea of what a visitor had been doing on your store. You may use email as a unique ID too, provided the person is already logged in.
The other is a typical e-commerce dashboard you might already have seen multiple times:
Conclusion
Building these dashboards completed the analytics pipeline from data collection to visualization. Once reliable tracking is in place, tools like Data Studio and BigQuery make it possible to answer business questions that standard GA4 report oftenc can not.
This was my first professional encounter with Data Studio and its integration with GA4 and BigQuery. You can do so many things, depends on your requirements. I hope my post has some ideas for your next project,
Related posts:
 Implementing Browser and Server Side Tracking on Shopify Using GTM and Meta CAPI
 Create your first sales dashboard in Apache Superset
 Learn how to use Apache Superset to create an interactive e-commerce sales dashboard
 Create an Adaptive Customer Behavior Analytics Dashboard with Claude AI and Python
 Start
Start
