So far You have learned how to acquire data, process it and visualize it. Today I am going to talk about dashboards that what are they and how you can come up your own personal or enterprise dashboard for sales data by using Apache Superset.
What is a Dashboard?
According to Wikipedia:
A dashboard is a type of graphical user interface which often provides at-a-glance views of key performance indicators (KPIs) relevant to a particular objective or business process. In other usage, “dashboard” is another name for “progress report” or “report.”
Basically, a dashboard is an information management tool that could show information both in text and visual format in the form of charts, tables etc. Speaking of an e-commerce sales dashboard it helps the management to understand whether their company is able to meet different KPIs or not.
What is Apache Superset?
After Airflow, Superset is another open-source tool offered by Airbnb. Apache Superset is a python based Dashboard that interacts with different kinds of data sources and provides insights about the data with the help of aggregation charts, tables, and maps. It is a modern, enterprise-ready business intelligence web application. It is developed in Python Flask and supports many data sources.
Installation and Setup
You can either opt for a docker version or the one you use on the local machine. For starters, I will prefer the local version. Just use pip to install locally; it will also install all dependencies. By default, it stores all configuration in an SQLite DB with the name superset.db.
pip install superset
During installation, it will ask to create admin user/passwords which you will have to use while creating dashboards. You can always reset the password by using the command line flask fab utility.
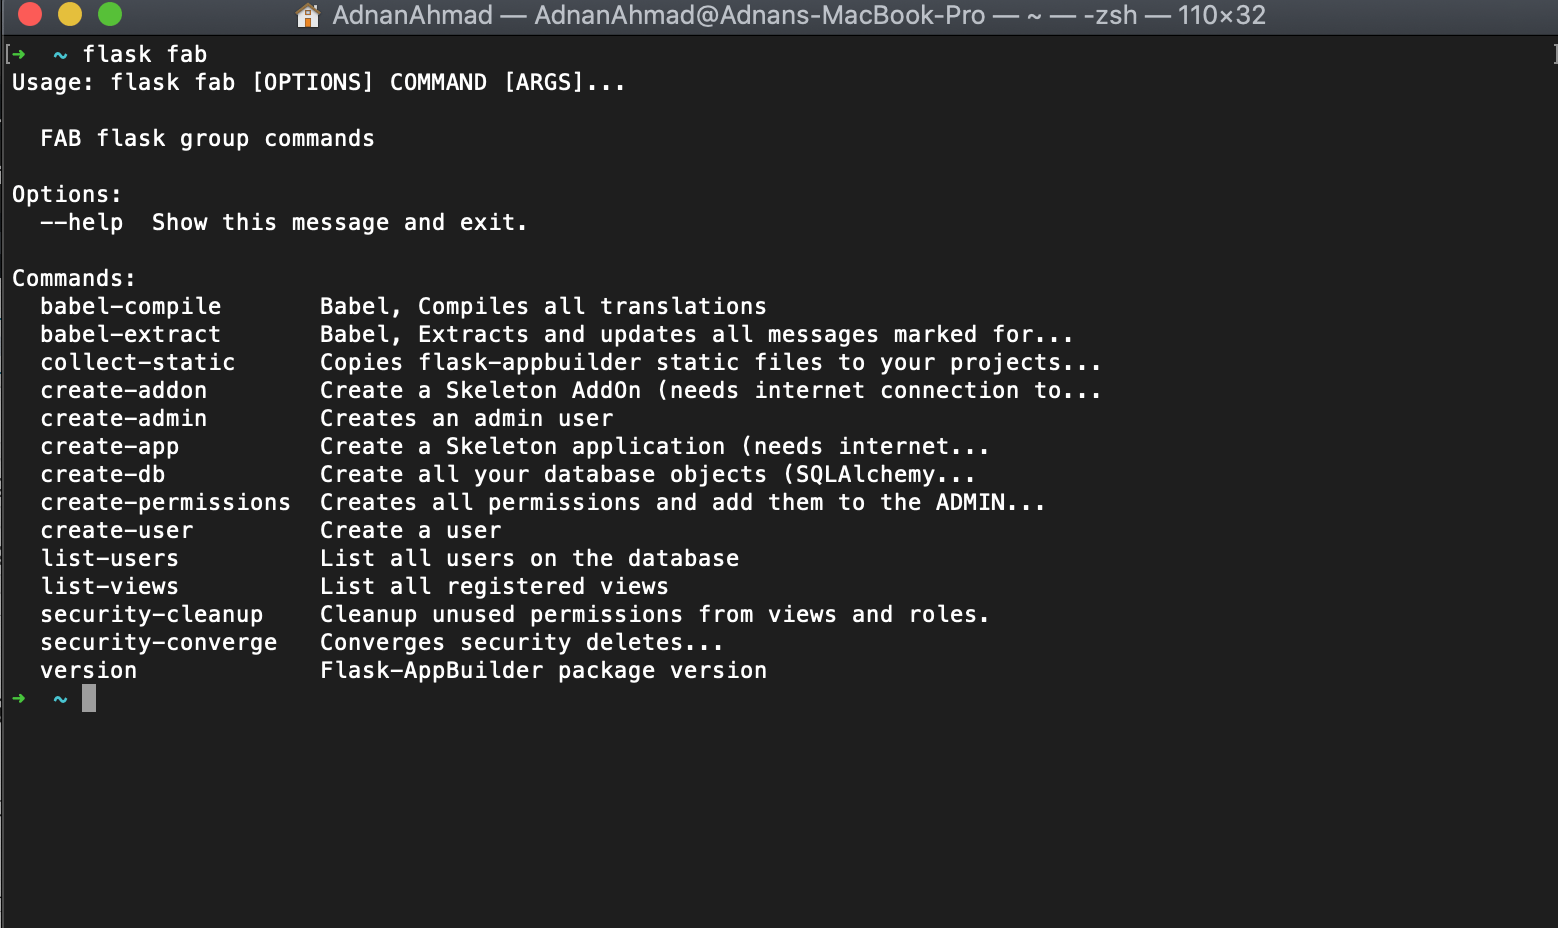
Once installed, you may check it by running superset command on the terminal.
➜  ~ superset
2019-12-10 13:42:30,750:INFO:root:Configured event logger of type <class 'superset.utils.log.DBEventLogger'>
Usage: superset [OPTIONS] COMMAND [ARGS]...

  This is a management script for the Superset application.

Options:
  --version  Show the flask version
  --help     Show this message and exit.

Commands:
  db                        Perform database migrations.
  export-dashboards         Export dashboards to JSON
  export-datasource-schema  Export datasource YAML schema to stdout
  export-datasources        Export datasources to YAML
  fab                       FAB flask group commands
  flower                    Runs a Celery Flower web server Celery Flower
                            is...
  import-dashboards         Import dashboards from JSON
  import-datasources        Import datasources from YAML
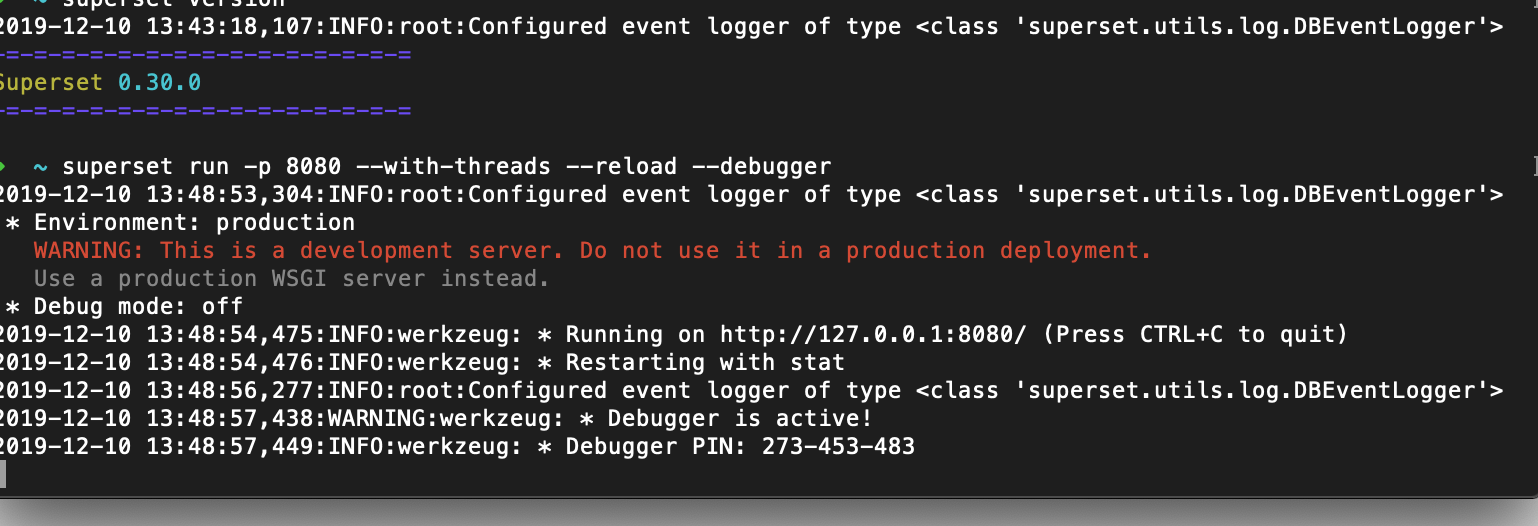
Now it’s time to start the dashboard server.
superset run -p 8080 --with-threads --reload --debugger
Assuming this port is available, you will see a screen something similar given below:
And when you visit http://127.0.0.1:8080 then you will be welcome by this screen:
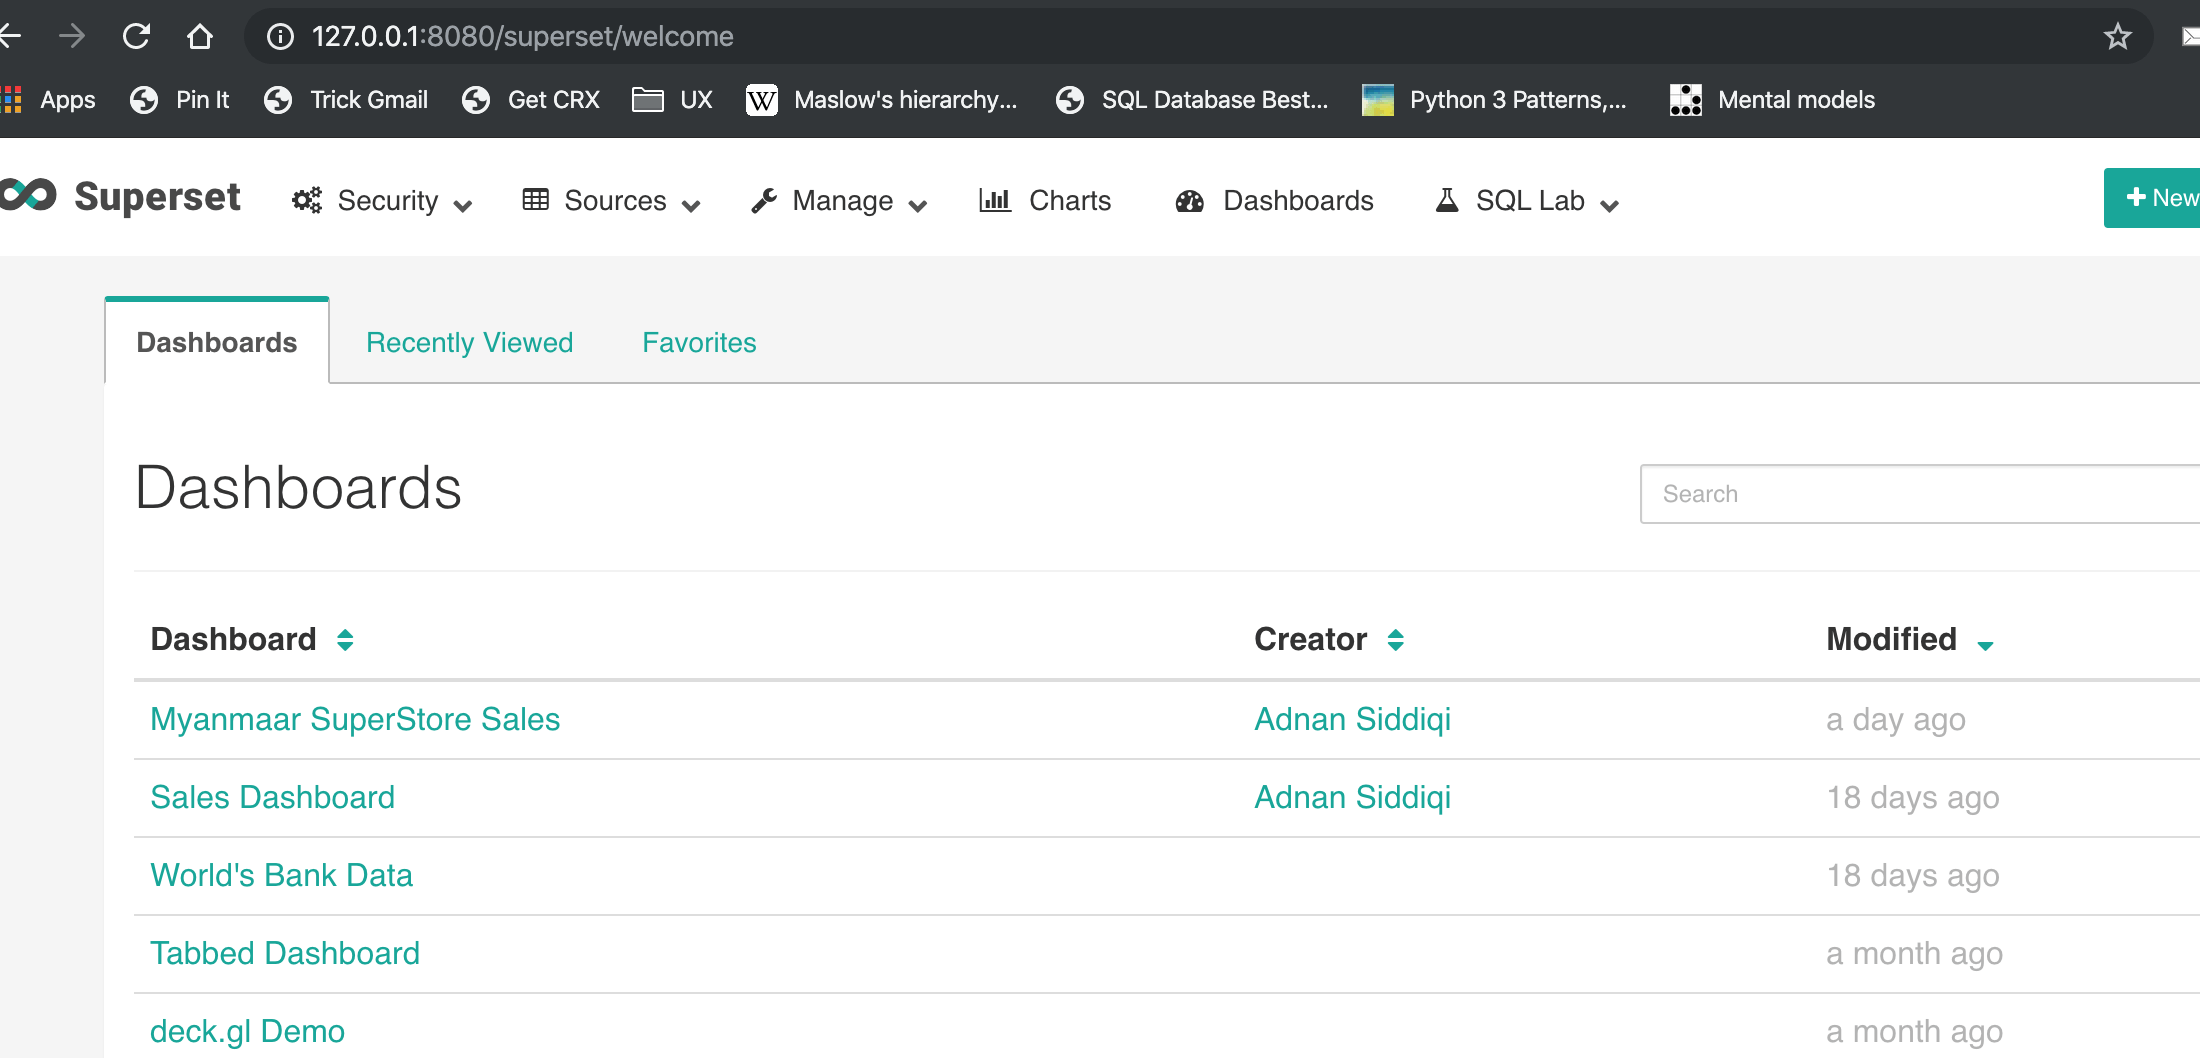
Click on the sample World Bank Data option and it will give you an extensive overview:
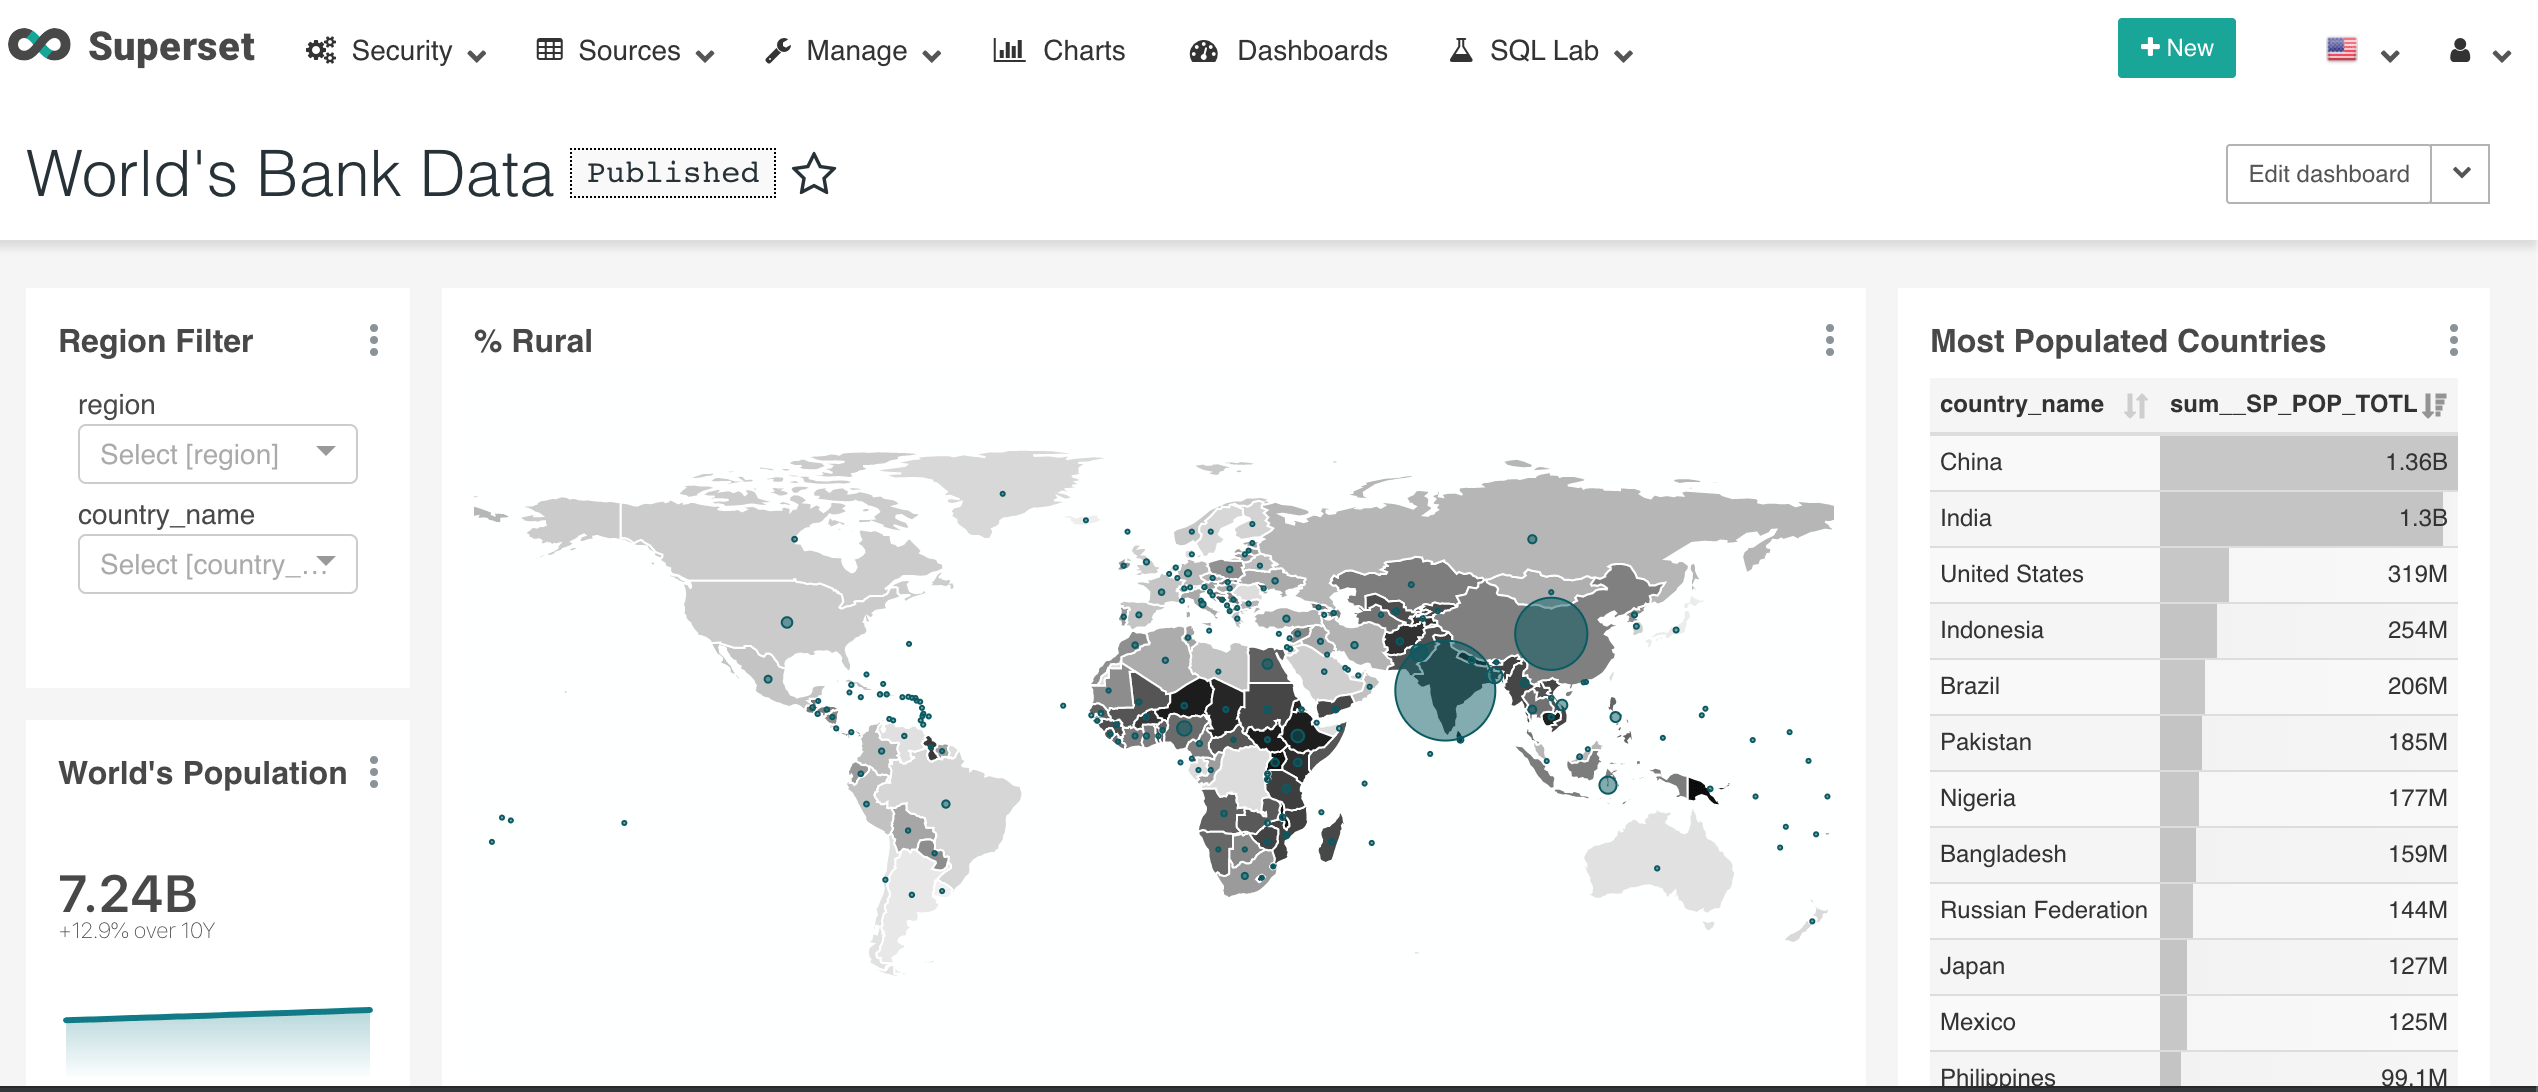
Before I move further, allow me to discuss a few terminologies related to Superset:
- Sources:- It is for picking the dataset or database that you want to further explore via Superset. Superset supports all SQLAlchemy compatible data sources.
- Slices:- A single unit that gives insights about data. It could be either visual or textual. One of the examples could be the total number of registered users since the beginning.
- Matrix:- In a dashboard, a matrix indicates what kind of information are you willing to explore, mostly it’s an aggregated value. For example, in the above example, the total number of registered users is a matrix. Slice uses this aggregated value and renders the info either in a chart form or textbase.
- Dimension:- Dimension tells what piece of info is being aggregated so that it could be shown on a dashboard. Extending the sample example, we could have a dimension, called, year, which can be used to find registered users per year.
E-commerce Dashboard Creation
Alright, so we are going to create our first dashboard which will help to take current and future decisions. I got the data from Kaggle and did a bit of cleaning and EDA based on this kernel. My Notebook is available in the form of Github gist which I used to prepare data based on my requirements.
https://gist.github.com/kadnan/b6e33532e85472467f5a5d8feac75e89
The Jupyter notebook generates a table which then connects with Apache Superset for further exploration.
Connecting Superset with Database
The most important thing you have to do is to connect your database. Let me clarify to you here; Apache Superset does NOT create a database or its tables. It assumes you have your data ready either in a table or views. Superset does not support typical SQL joins so you should have your materialized views ready that pull data from multiple resources. Each table connection to a database is atomic so it is not like you create one data source and include multiple tables in it.
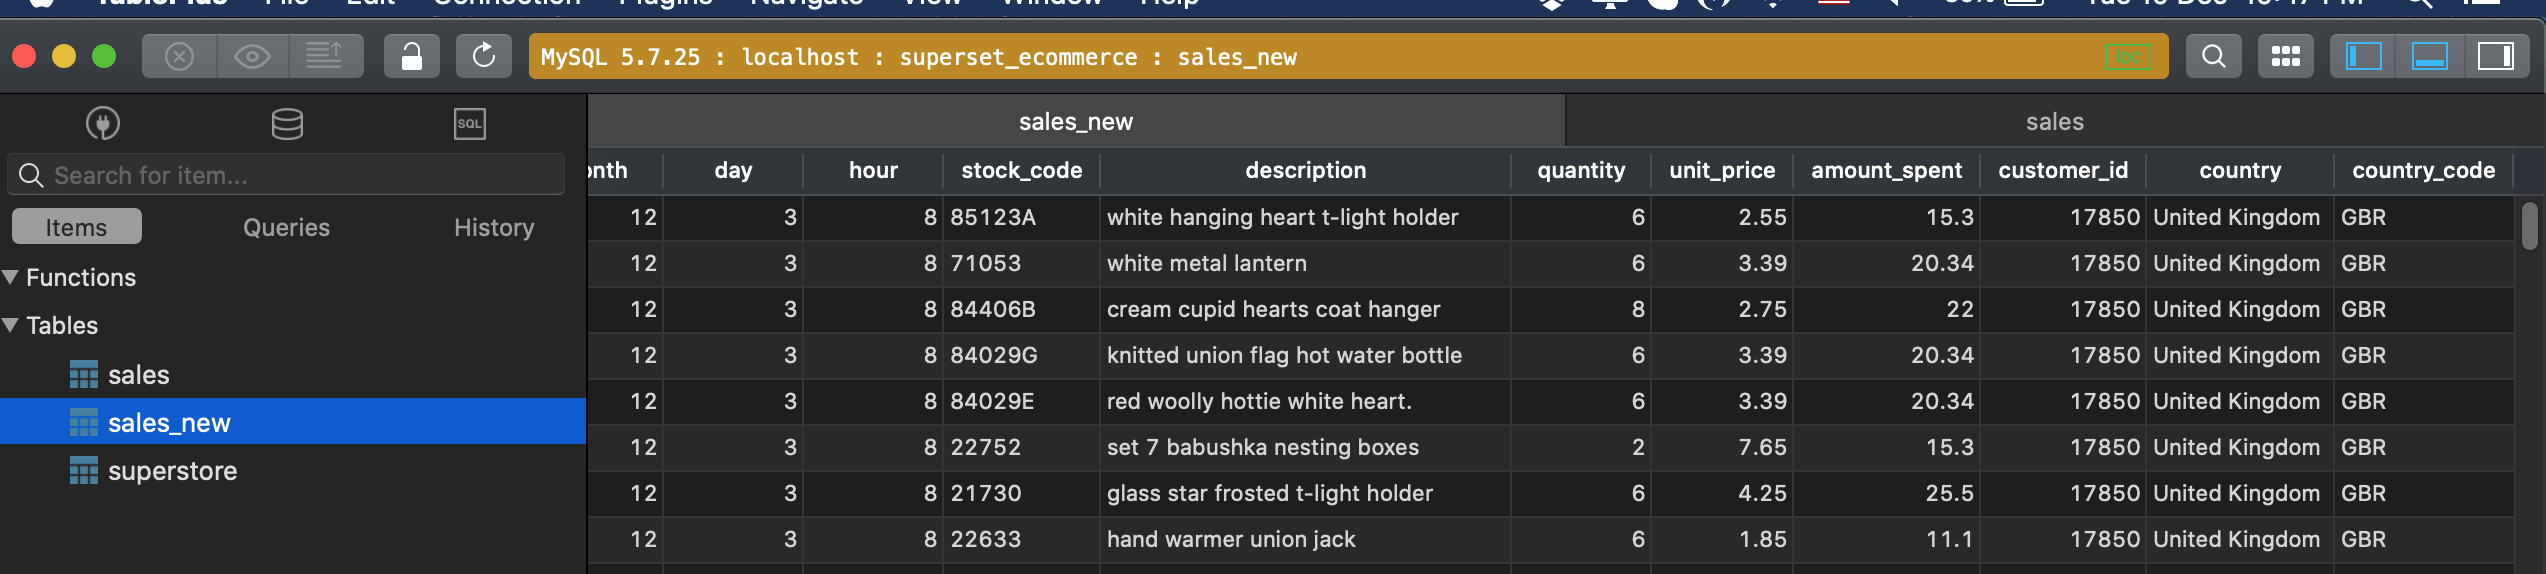
As you can see here, I dedicated a new Db, named, as superset_ecommerce and dumped all the data into a table called sales_new. By following the instructions given on the official site, my database entry looks like below:
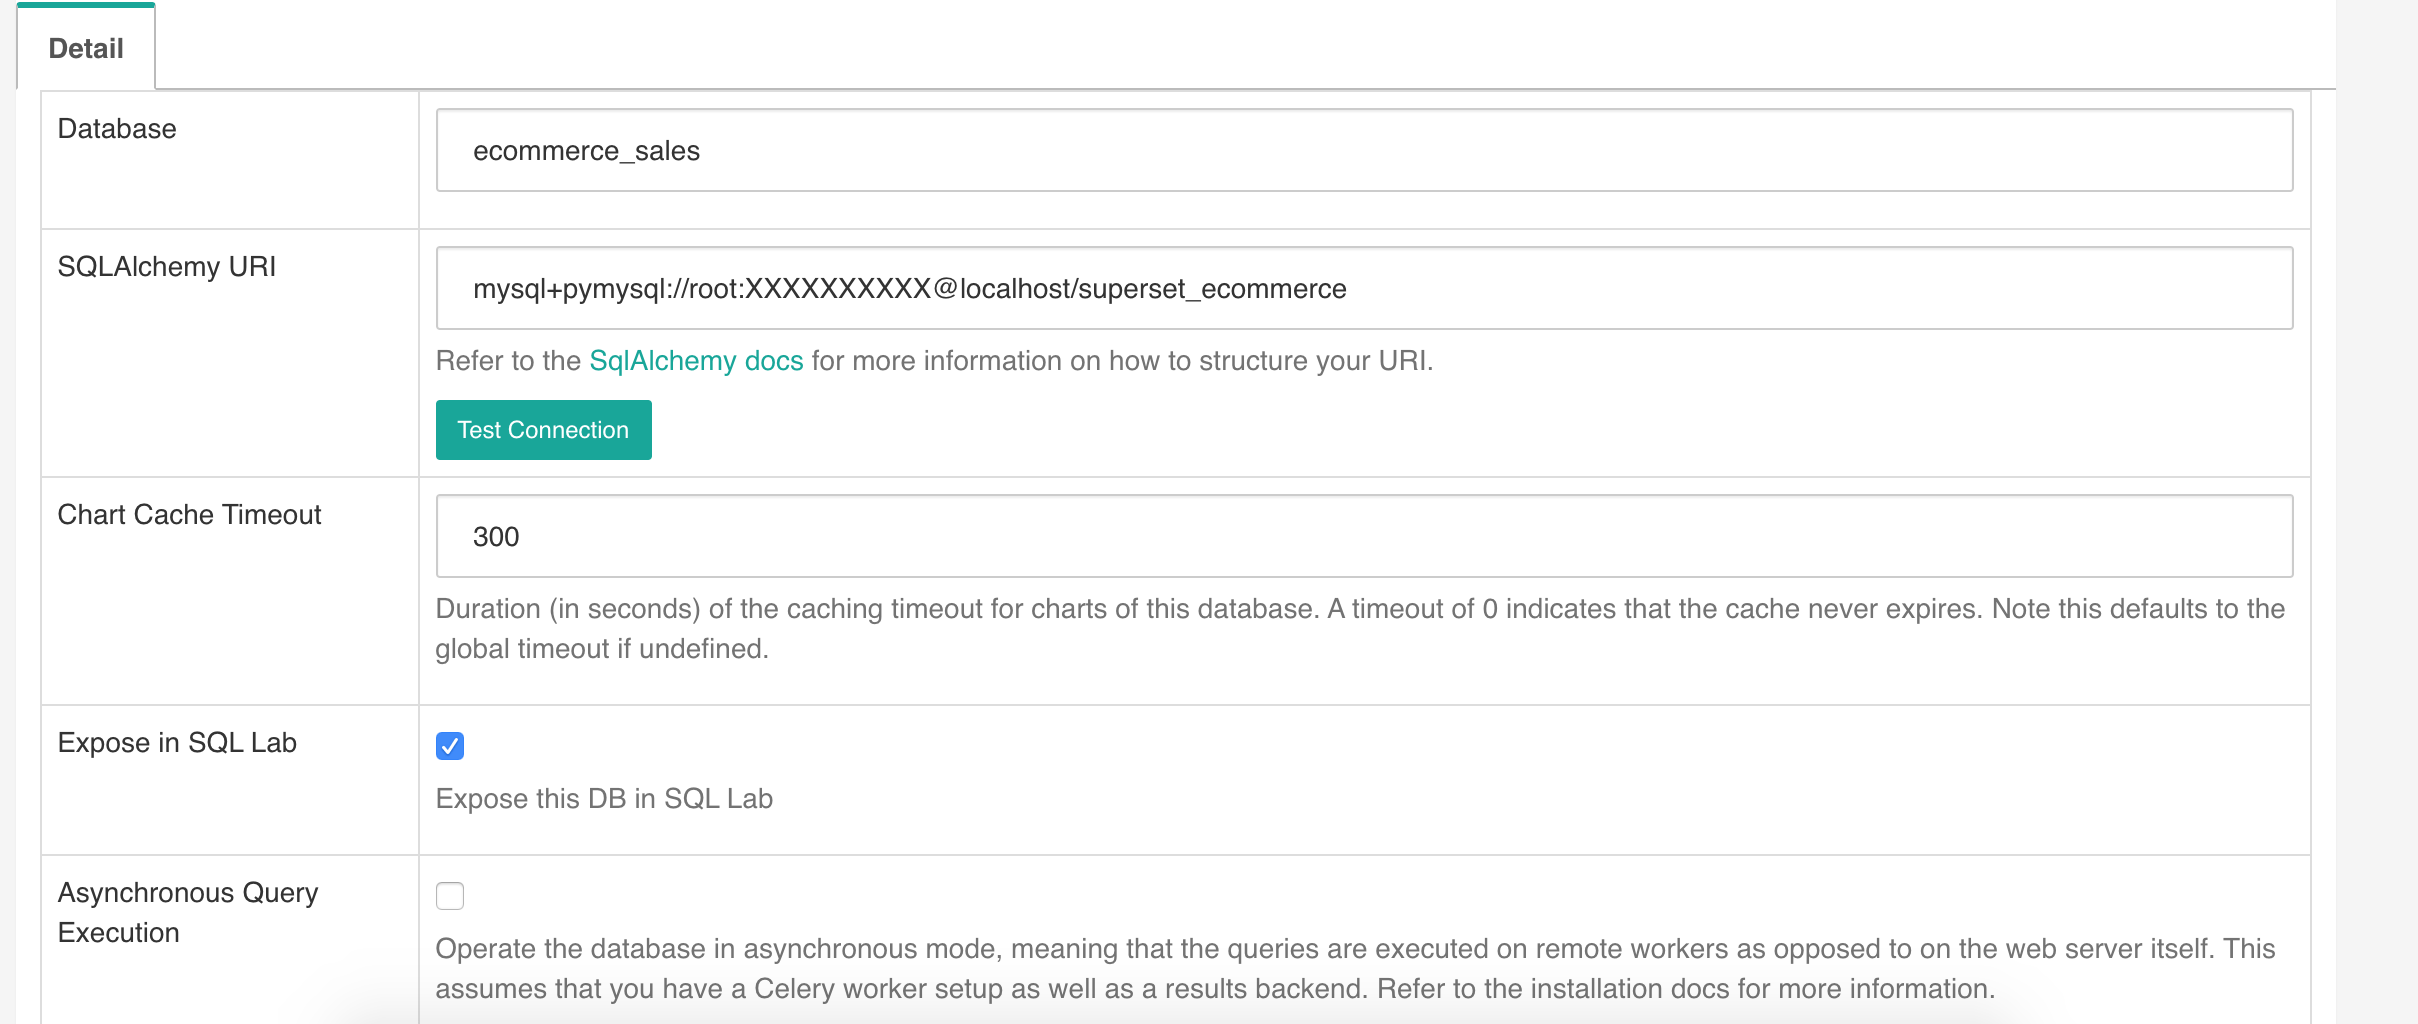
Do not forget to check to Expose this DB in SQL Lab link as it helps power users to create custom queries for verification or exploration.
So our Db is connected, it’s time to pull in our required table. Go to Source -> Tables from top navigation bar and you will a list of existing tables.
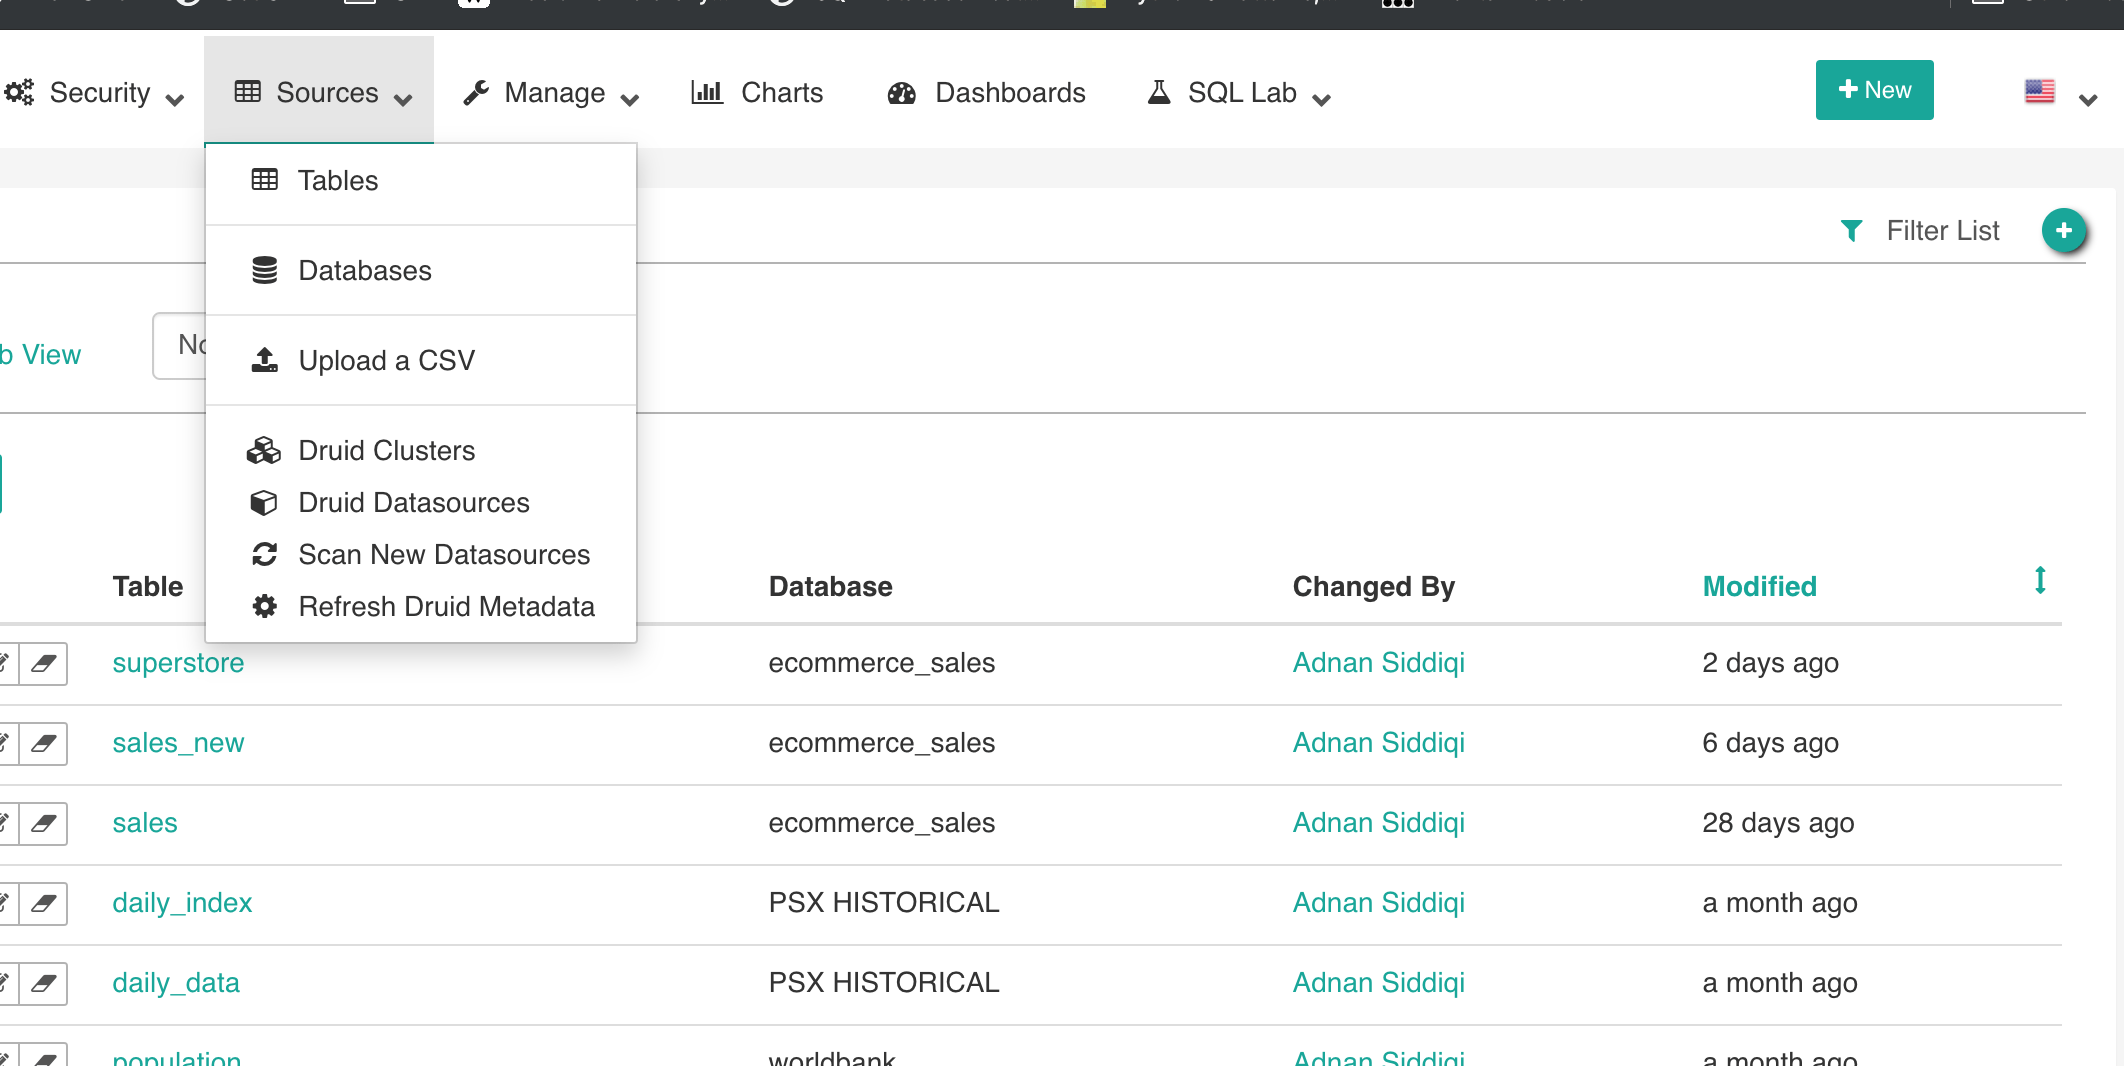
You click the + sign on the top right and it will show the interface like below. You select your required DB to import details and enter the existing table name.
Once done you will something like:

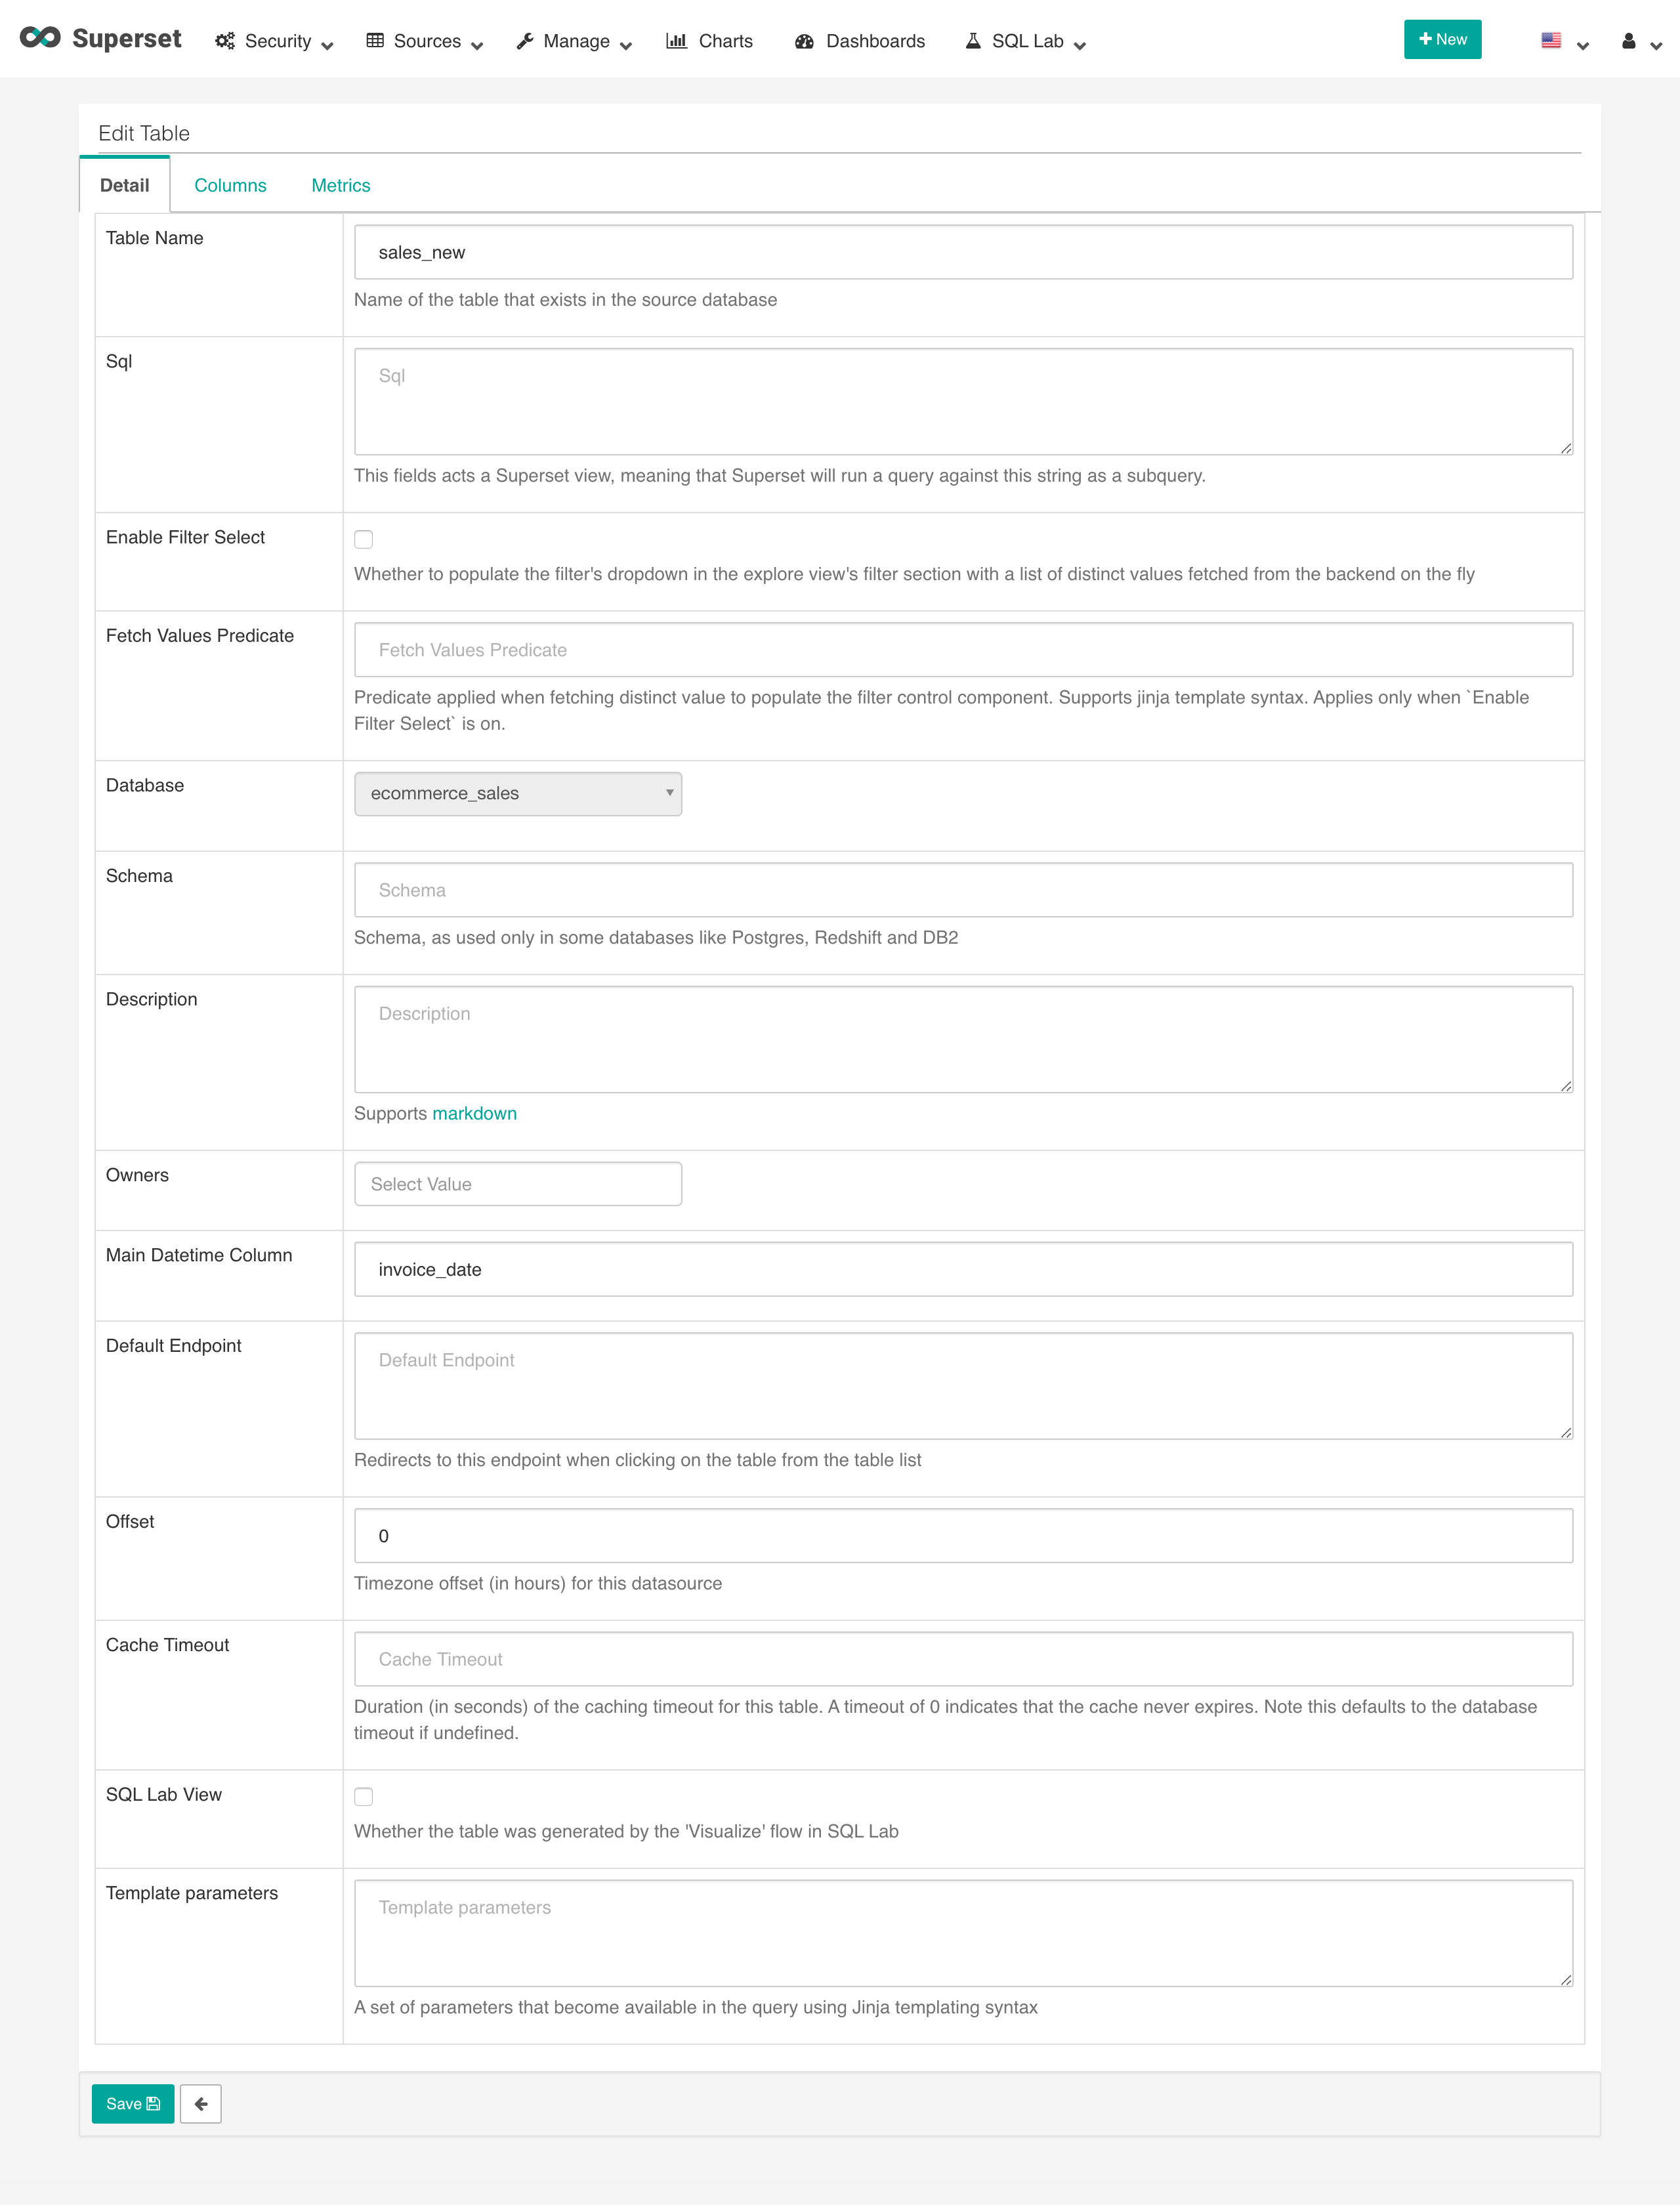
Clickin on the table name will show an interface like below:
Now the time has come to add your slices. It is obvious that as a Superset Administrator (what, really?), you must be aware of what kind of info you(or your management) is interested in. You might be looking pieces of info like:
- Top 5 buyers’ country name.
- Total sale
- Top customer
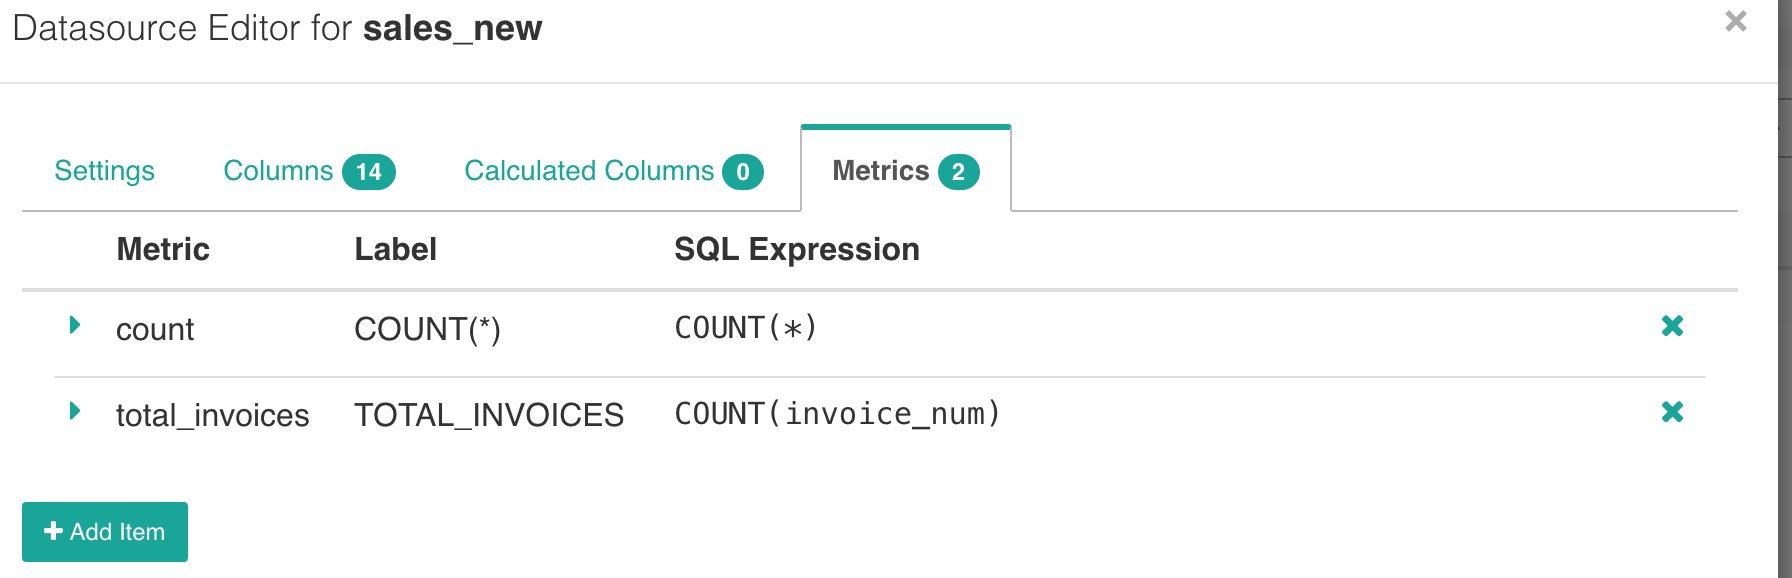
And maybe many other dimensions. Let’s focus on the first one. In order to get these figures, we will be using count() on invoice_num field and then will limit it up to 5 rows only. I have to add a metric, total invoices. To do that, I will have to edit the Datasource.
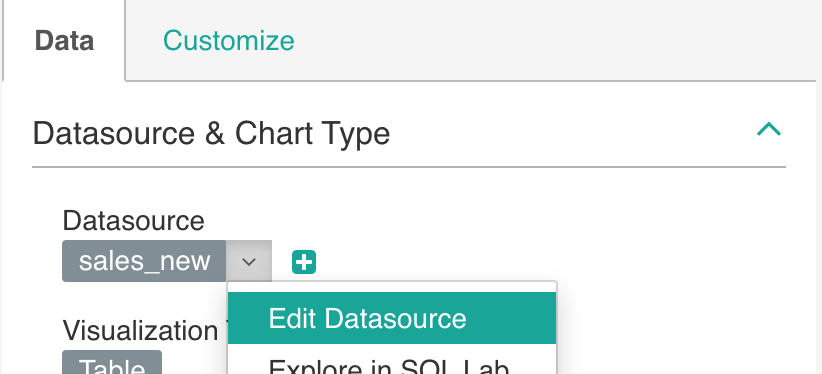
Once you click on it, it pops up a window like below:
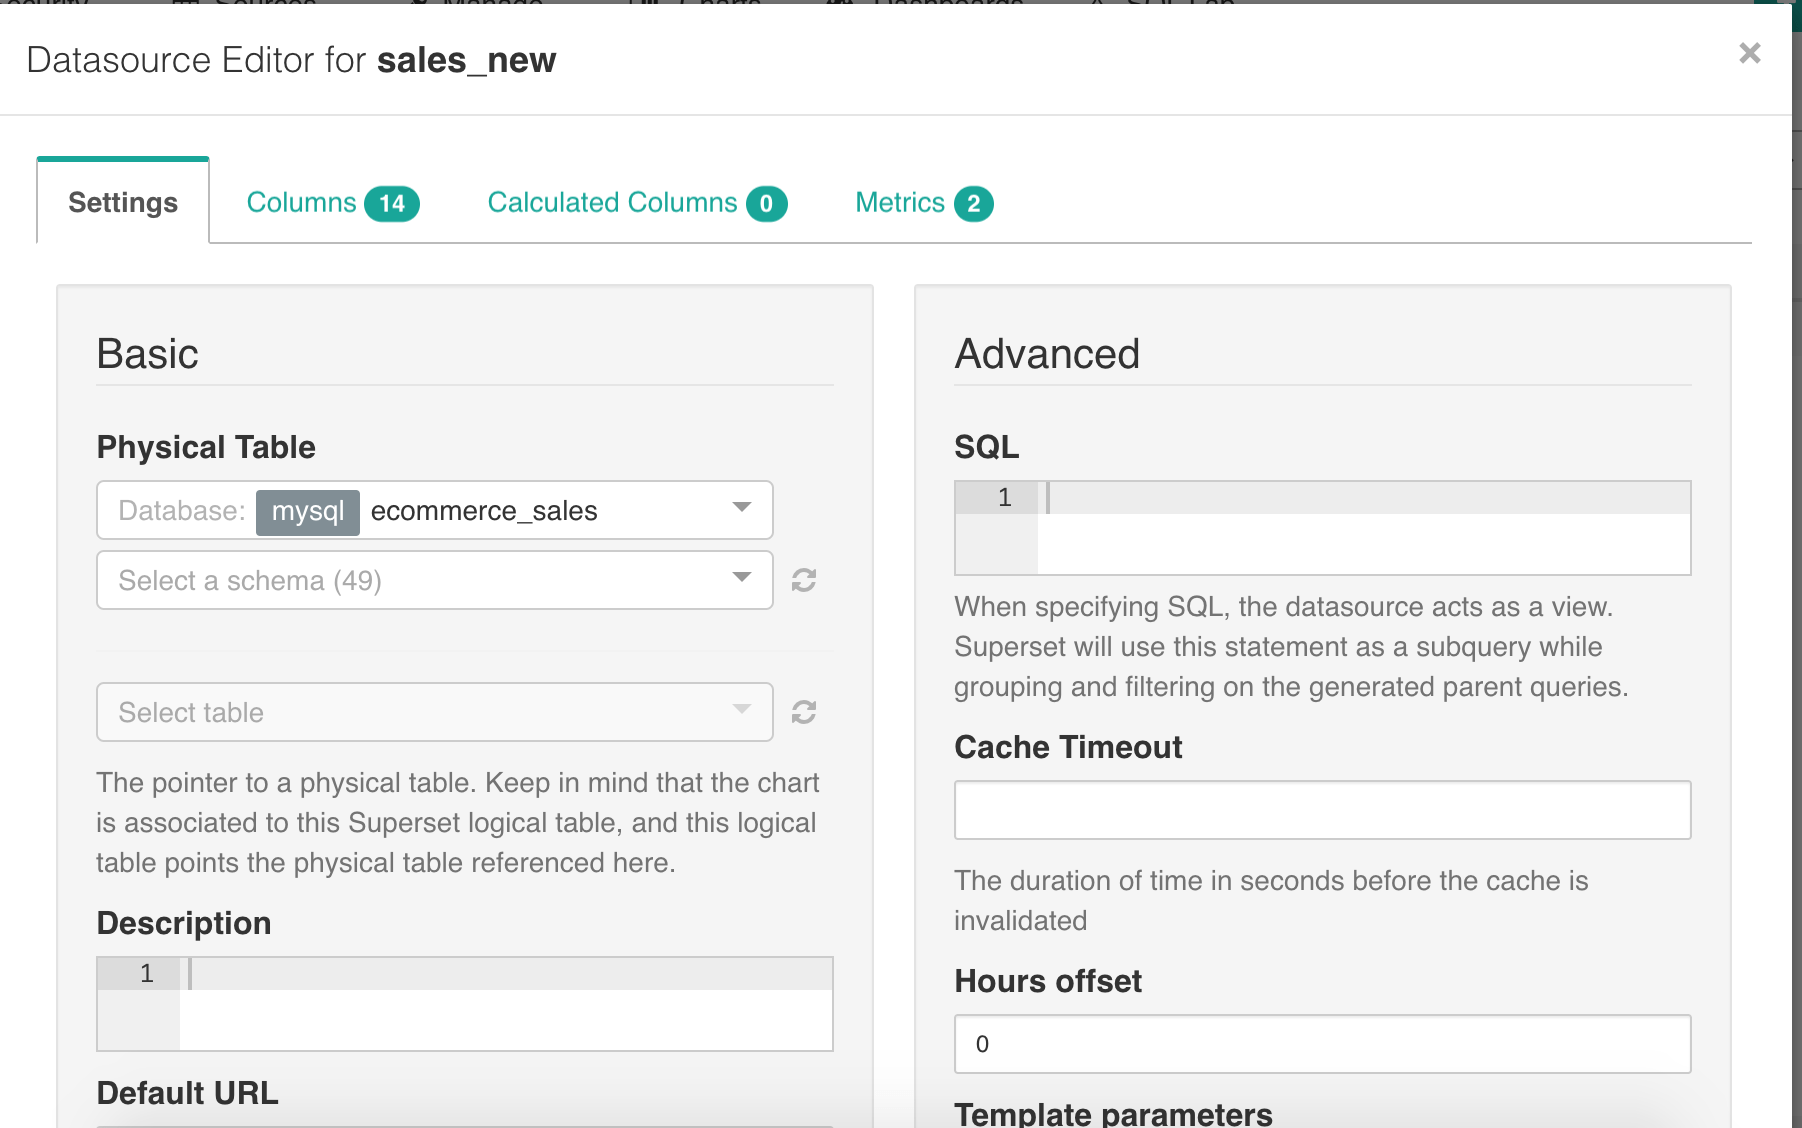
Go into the Metrics option and add a new one like below:
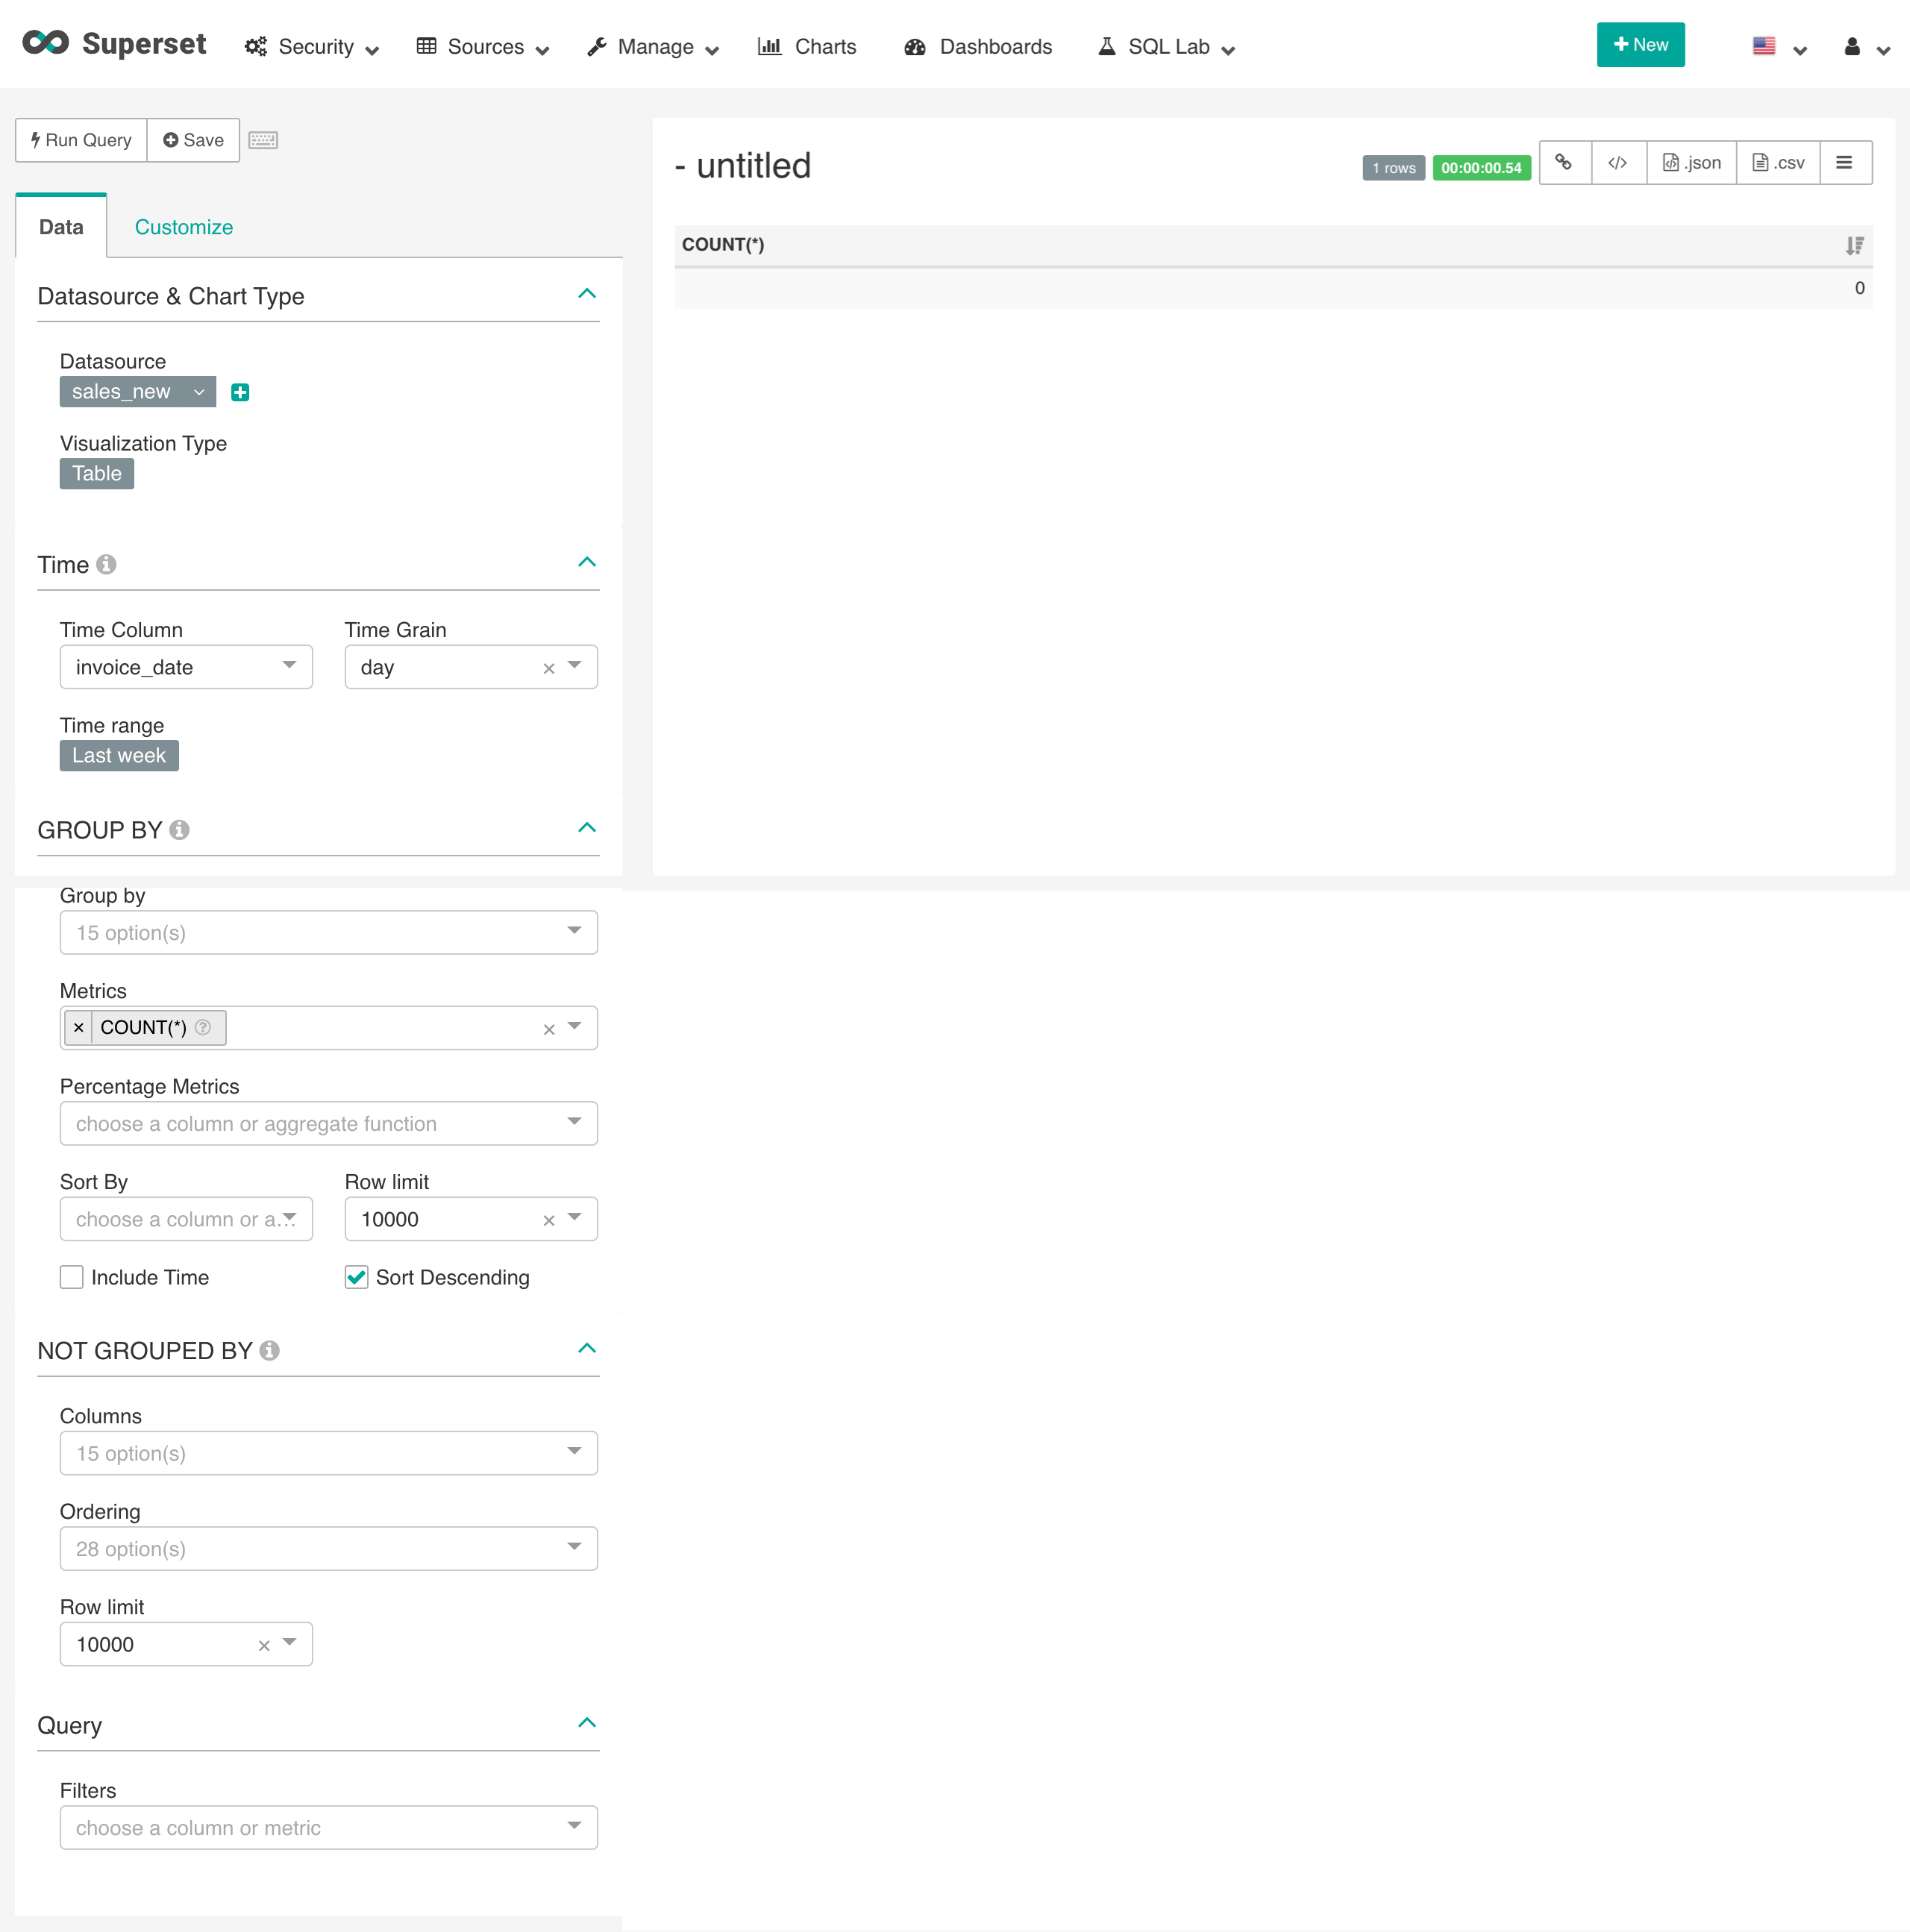
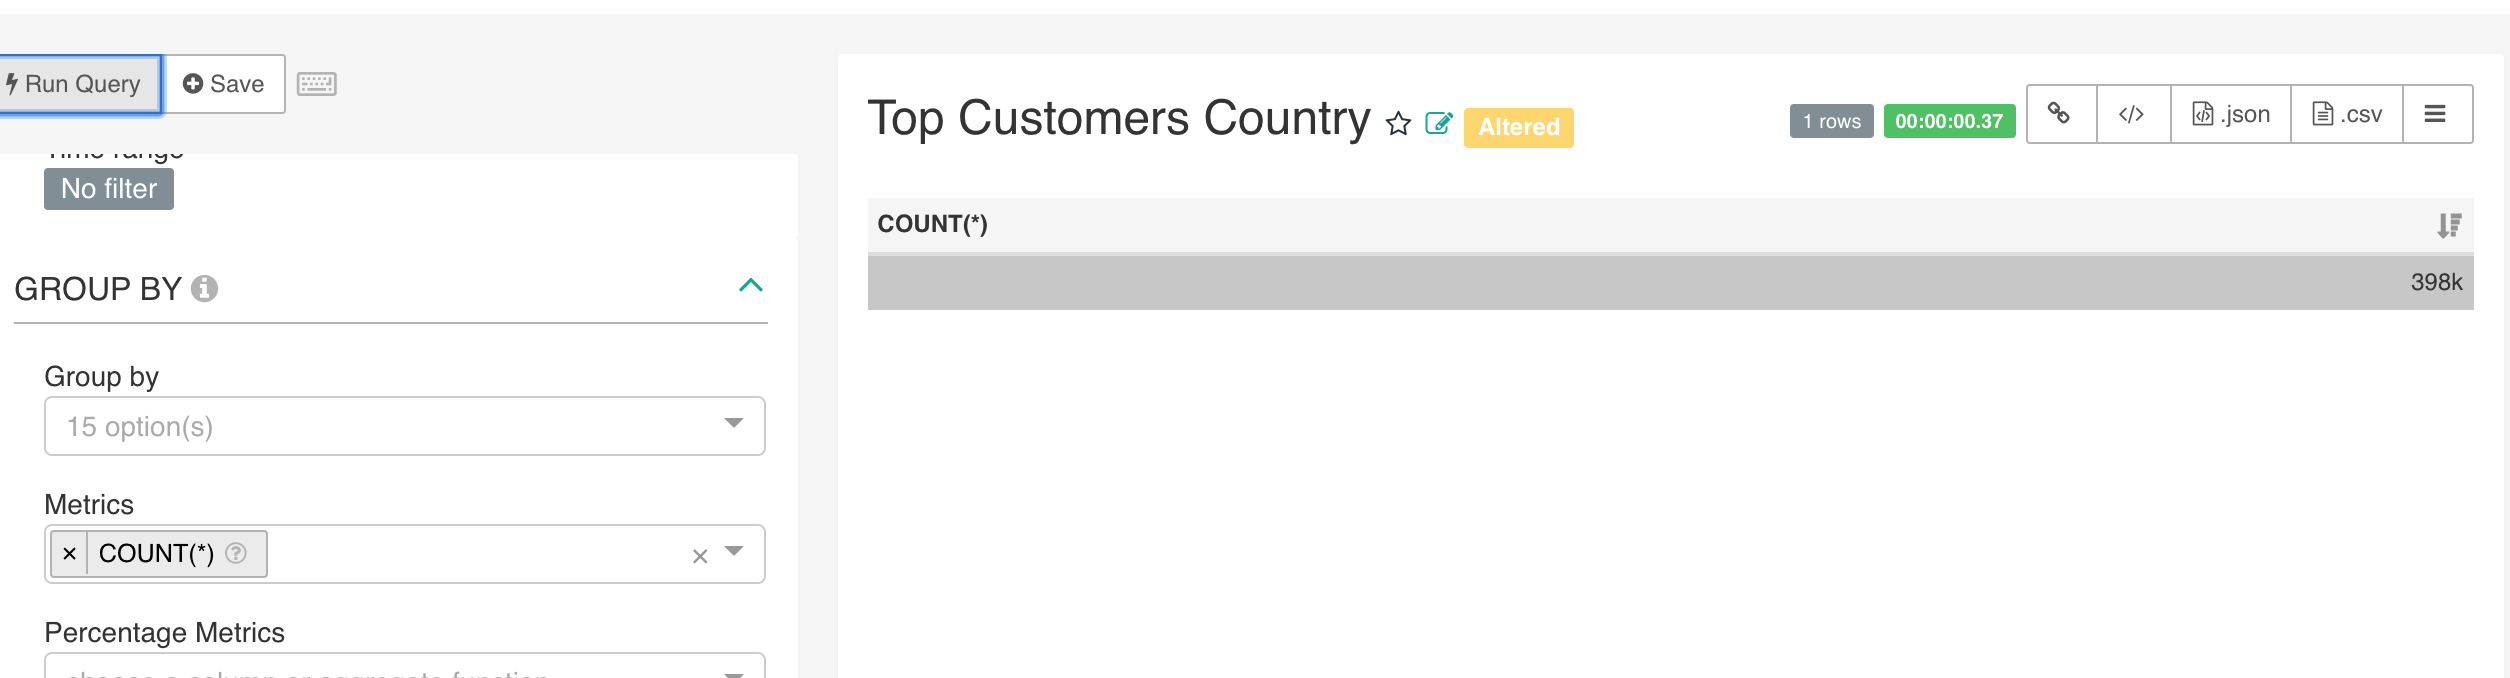
Good! Let’s move one. On the Explorer interface, you will see a 0 count on the right side of the interface. It is because the data is old, all I will do is to unset time range like below:

Once done, you run the query and this time you will get the count 398k. Total records in the table irrespective of any condition.
We have to find out Top 5 customers’ country name along with invoice count.
As you can see in the animated demo, first I grouped by country field and then used TOTAL_INVOICE as a matrix. Since I only need the Top 5 entries I also set the limit to 5.
So far so good but this text does not look appealing, how about picking a bar graph?

As you can see above how I converted text-based info to a visual one which is interactive too! How cool is that, No?
Now when you save the chart, it asks whether only save the chart or add on a dashboard as well.
While saving it asked to put on a dashboard, either new or existing. I created a new dashboard as we are creating an entirely new dashboard. The other charts will be put on this dashboard.
Again, I am going to add another piece of info. This time top 5 customers’ ID and their countries. We will be repeating same procedure. You can always check your existing slices by opening Charts option on top.
I added another chart, the top 5 customers. Once you add multiple slices on the dashboard, you can adjust their position as you want. You may also add custom visual components, just like I added the header component.
Similarly, you can add a world map of the same data, that is, the top 5 customers.
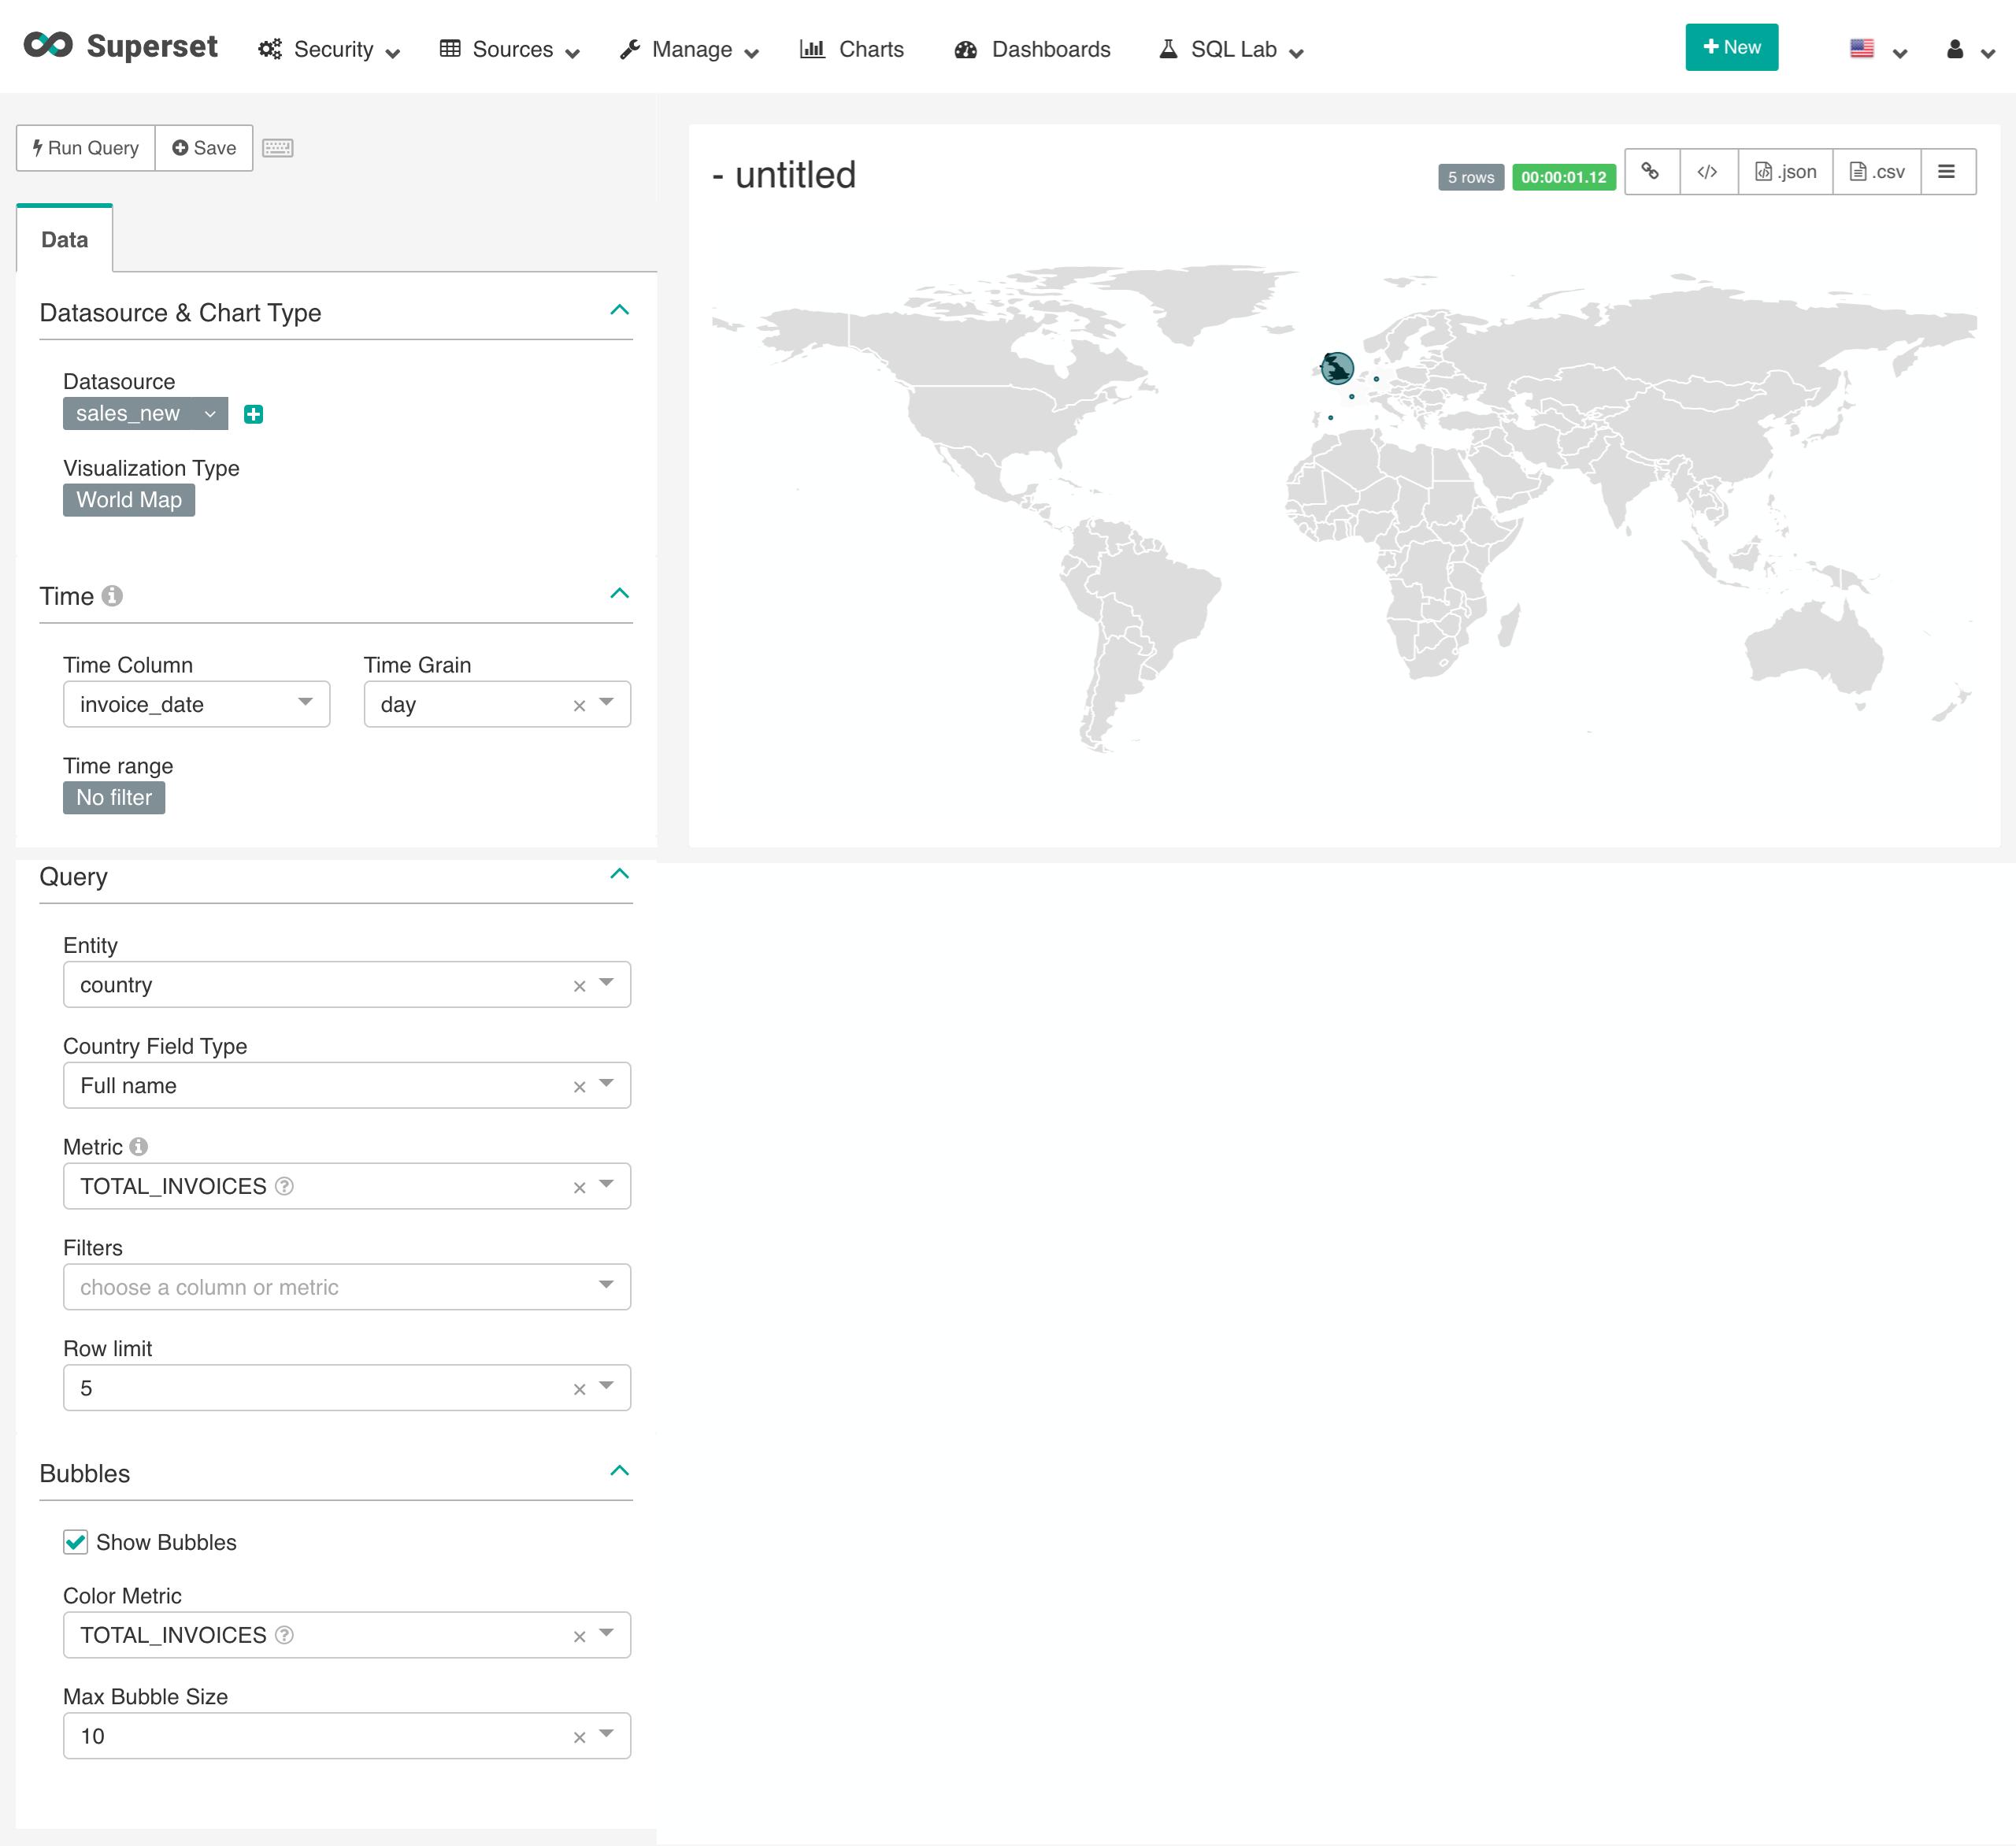
After saving on the dashboard it looks like below. The bubble tells the size of the count per country.
Conclusion
In this post, I tried to cover the basics of Apache Superset. It is a very powerful tool for Business Intelligence(BI) purposes, easy to customize and use. It also allows creating role-based dashboards, for instance, HR would have different KPIs hence different dashboards which should not be visible to the sales team, a vice versa I have just touched the basics of it.