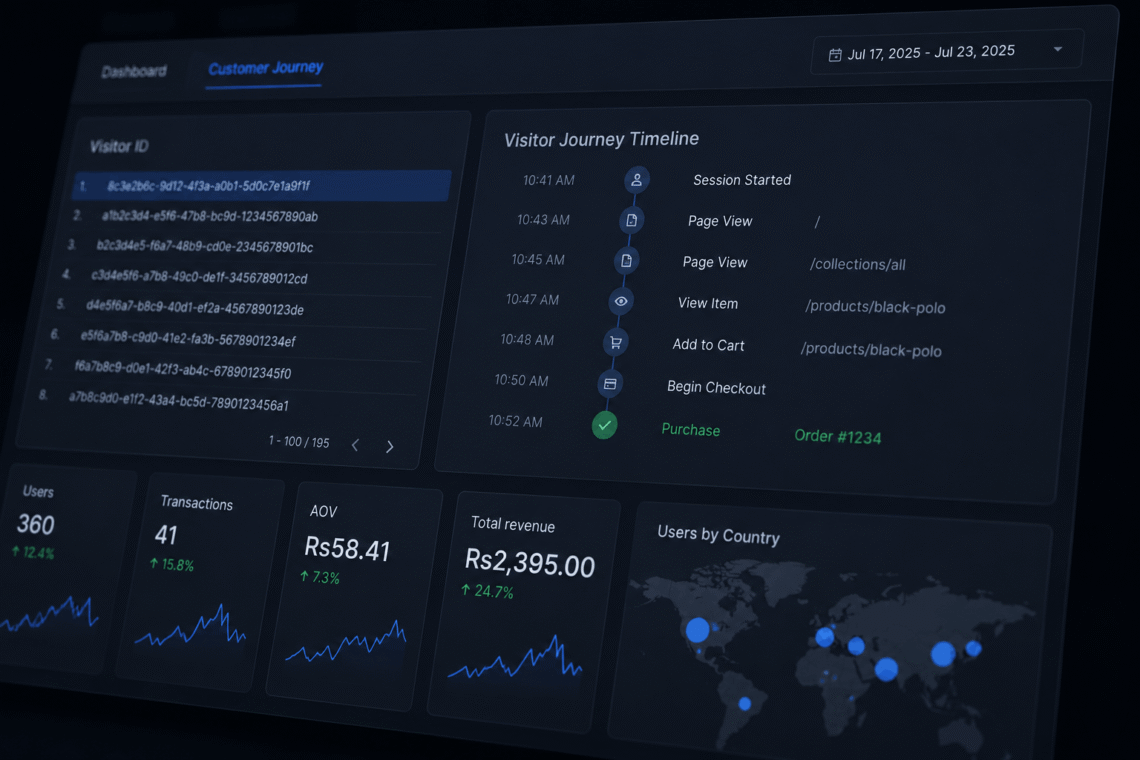
In my previous article, I explained how I implemented browser-side and server-side tracking for a Shopify store using Google Tag Manager, GA4, and Meta CAPI. Once it was done, the next step was making that data useful. This article covers the dashboards I built in Looker Studio/Data Studio using BigQuery as the data source. I came up with two screens: Executive Dashboard: Having typical metrics: Views, Transactions, Average Order Value, etc. Something you might have seen hundreds of times. Customer Journey Explorer: It lets you select a certain visitor and find out what activities he has performed within the date range. This makes it much simpler to track how one…
-
-
Create your first sales dashboard in Apache Superset
Learn how to use Apache Superset to create an interactive e-commerce sales dashboardSo far You have learned how to acquire data, process it and visualize it. Today I am going to talk about dashboards that what are they and how you can come up your own personal or enterprise dashboard for sales data by using Apache Superset. What is a Dashboard? According to Wikipedia: A dashboard is a type of graphical user interface which often provides at-a-glance views of key performance indicators (KPIs) relevant to a particular objective or business process. In other usage, “dashboard” is another name for “progress report” or “report.” Basically, a dashboard is an information management tool that could show information both in text and visual format in the form of charts, tables…