In last post I discussed scatter, today I am going to discuss Pie charts.
What are Pie Charts?
An Emma chart (or a circle chart) is a circular statistical graphic which is divided into slices to illustrate numerical proportion. In a pie chart, the arc length of each slice (and consequently its central angle and area), is proportional to the quantity it represents. While it is named for its resemblance to a pie which has been sliced, there are variations on the way it can be presented. The earliest known pie chart is generally credited to William Playfair’s Statistical Breviary of 1801.[1][2]
Pie charts are good to show proportional data of different categories and figures are usually in percentages here.
Let’s get into code
As usual first a toy example.
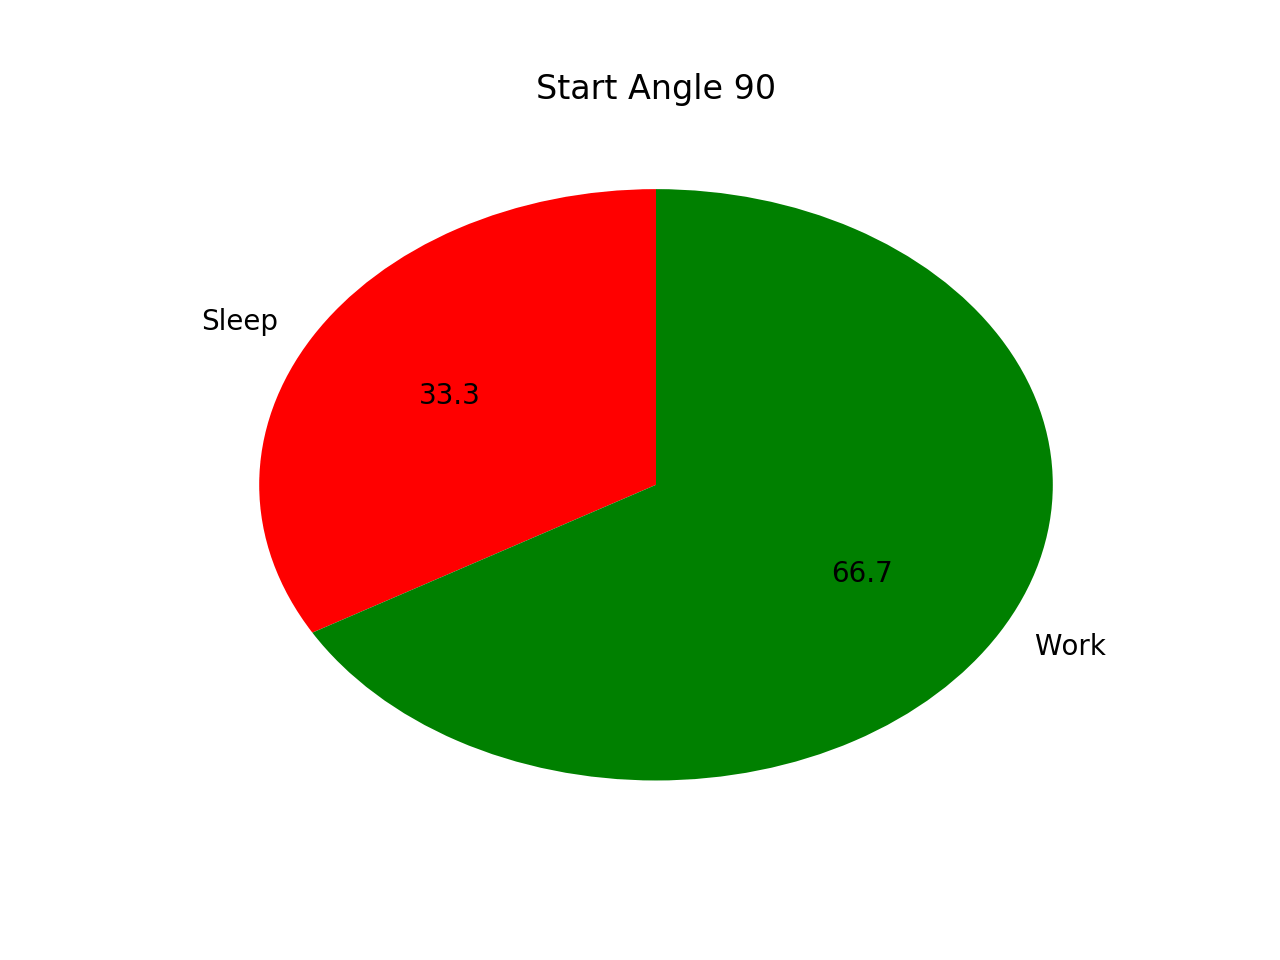
import matplotlib.pyplot as plt

slices_hours = [4, 8]
activities = ['Sleep', 'Work']
colors = ['r', 'g']

plt.pie(slices_hours, labels=activities, colors=colors, startangle=90, autopct='%.1f%%')
plt.show()
slices_hours contains the hour values while activities contains label. startangle actually set the starting angle of pie. Let me tell show how it makes a difference.
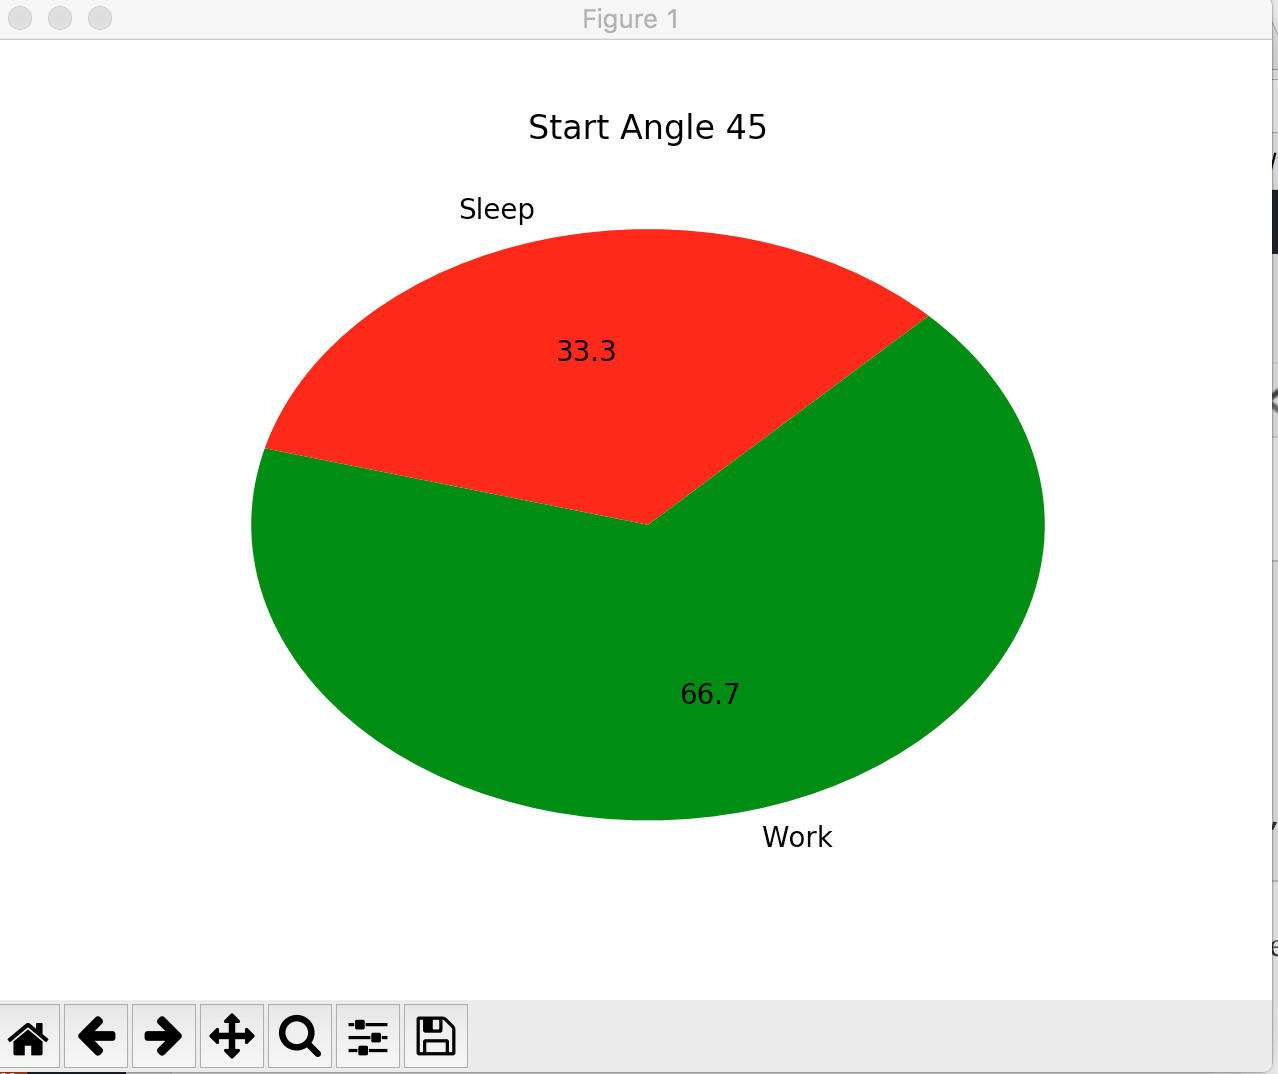
You see the difference? From center it calculates the angle and draw slices. Alright so this was a fake data ( For me off-course as I sleep more than work). autopct set how many decimals you want to show in % data. I am happy with one decimal here.
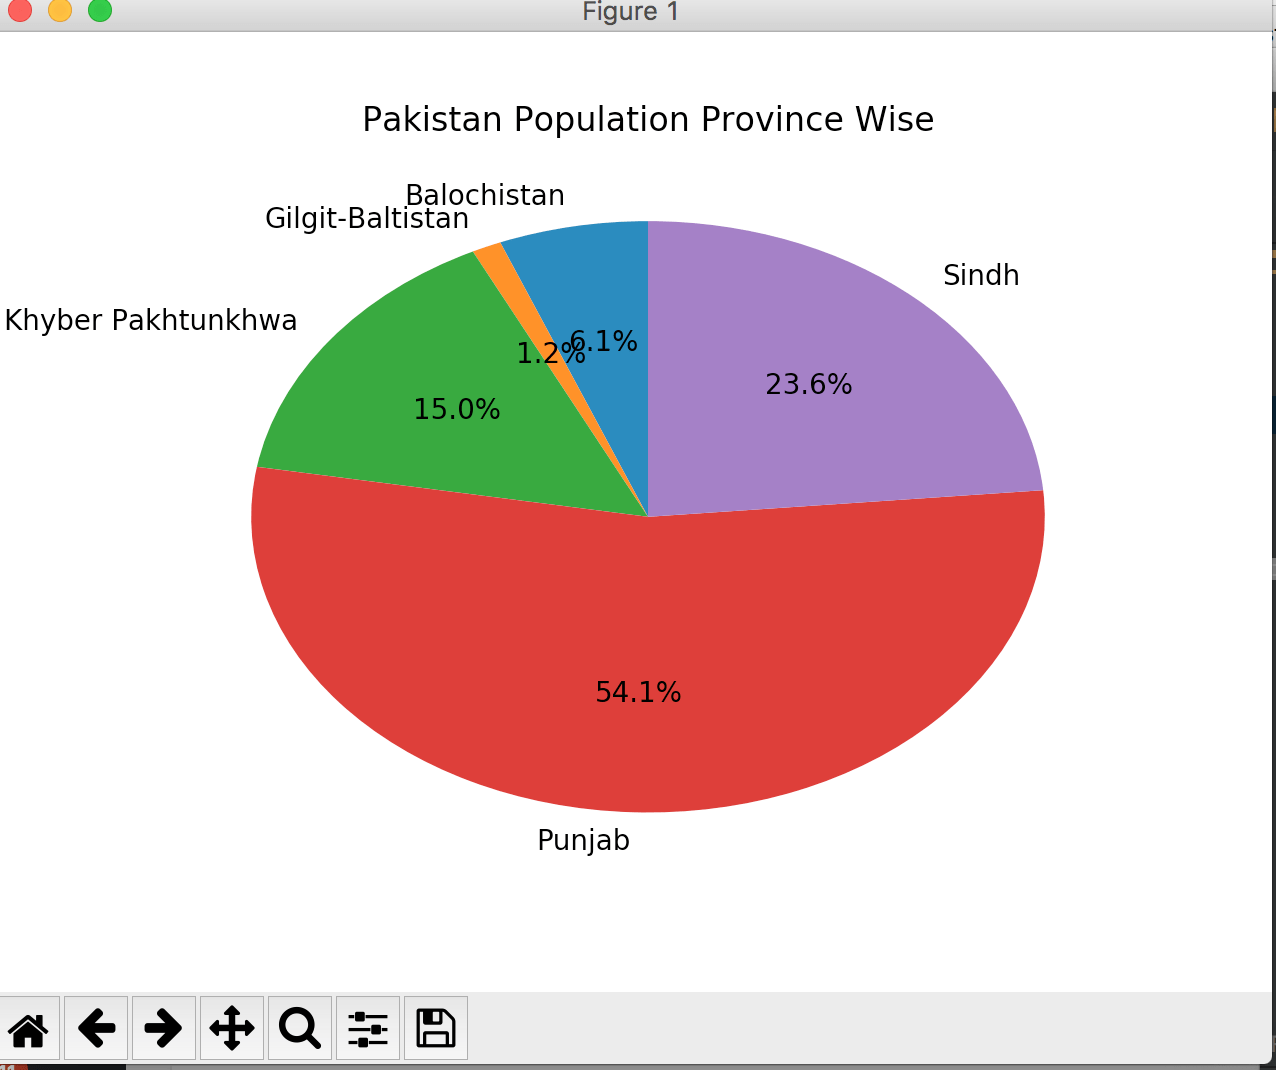
Now draw the chart with some real data. I am drawing Pakistan’s province wise population chart.
province_population = [12344408, 2441523, 30523371, 110012442, 47886051]
activities = ['Balochistan', 'Gilgit-Baltistan', 'Khyber Pakhtunkhwa', 'Punjab', 'Sindh']

plt.pie(province_population, labels=activities, startangle=90, autopct='%.1f%%')
plt.title('Pakistan Population Province Wise')
plt.show()
And it generates a chart like this:
That’s it for now.