Last updated: April 2026
Looking for a CCXT Python tutorial with real examples? In this guide, you’ll learn how to use CCXT to fetch OHLCV data, ticker information, and order book data using simple Python code.
I already used the CCXT Library in my Airflow-related post here. In this post, I will discuss the library and how you can use it to pull different types of data from exchanges or trading automation. The demo can be seen here.
What You’ll Learn
- Fetch OHLCV (candlestick) data
- Get real-time ticker prices
- Access order book data
- Connect to Binance using Python
What is CCXT
CryptoCurrency eXchange Trading Library, aka CCXT, is a JavaScript / Python / PHP library for cryptocurrency trading and e-commerce with support for many bitcoin/ether/altcoin exchange markets and merchant APIs. It connects with more than 100 exchanges. One of the best features of this library is that it is exchange-agnostic: whether you use Binance or FTX, the signature of routines is the same. It is available in Python, JavaScript, and PHP. It supports both public and private APIs offered by different exchanges, but I am only going to discuss a few public API endpoints.
Development Setup
How to Install CCXT
pip install ccxt
Alright, the library is installed, let’s connect to an exchange. I am connecting to the Binance exchange for now.
Connect to the exchange
The very first and obvious step is to connect to the exchange first; it is pretty easy.
# Connect binance
binance = ccxt.binance()
Loading Markets
The exchange is connected; now it’s time to load all markets offered by the exchange. Usually, it is not used but it can give you a good idea of whether a certain pair is available or not.
Fetching Ticker Data
Let’s grab the info related to BTC/USDT.
btc_ticker = binance.fetch_ticker('BTC/USDT')
btc_ticker
and it returns:
{'symbol': 'BTC/USDT',
 'timestamp': 1634909924391,
 'datetime': '2021-10-22T13:38:44.391Z',
 'high': 65564.0,
 'low': 62000.0,
 'bid': 63363.89,
 'bidVolume': 1.32351,
 'ask': 63363.9,
 'askVolume': 0.27138,
 'vwap': 63105.52714333,
 'open': 65470.0,
 'close': 63363.9,
 'last': 63363.9,
 'previousClose': 65469.99,
 'change': -2106.1,
 'percentage': -3.217,
 'average': None,
 'baseVolume': 53395.84423,
 'quoteVolume': 3369572897.3972454,
 'info': {'symbol': 'BTCUSDT',
  'priceChange': '-2106.10000000',
  'priceChangePercent': '-3.217',
  'weightedAvgPrice': '63105.52714333',
  'prevClosePrice': '65469.99000000',
  'lastPrice': '63363.90000000',
  'lastQty': '0.00843000',
  'bidPrice': '63363.89000000',
  'bidQty': '1.32351000',
  'askPrice': '63363.90000000',
  'askQty': '0.27138000',
  'openPrice': '65470.00000000',
  'highPrice': '65564.00000000',
  'lowPrice': '62000.00000000',
  'volume': '53395.84423000',
  'quoteVolume': '3369572897.39724530',
  'openTime': 1634823524391,
  'closeTime': 1634909924391,
  'firstId': 1109039843,
  'lastId': 1110609081,
  'count': 1569239}}
Apart from Ticker and Timestamp, it returns data points like Open, High, Low, Close, Volume, Bid and Ask Price, etc.
Fetching OHLCV data
Fetching OHLCV data is pretty easy; all you have to do is:
btc_usdt_ohlcv = binance.fetch_ohlcv('BTC/USDT','1d',limit=100)
Here, the first argument is the trading pair, the second is duration, which tells whether you need day-level data, minutes, or a month. Each OHLCV entry represents a candlestick. Since the difference in time duration is a day, the data will always be in 24 hours of difference starting from 12 AM, Midnight UTC. The last parameter, limit is optional. When you print it, the data is returned in the following format:
[[1634774400000, 66001.4, 66639.74, 62000.0, 62193.15, 68538.64537],
 [1634860800000, 62193.15, 63732.39, 62000.0, 62680.01, 24059.82478]]
The data returns in the format: TIMESTAMP, OPEN, HIGH, LOW, CLOSE, and VOLUME. Let’s make it interesting. I will pull BTC/USDT price from Binance and FTX exchange and plot the graph of close values.
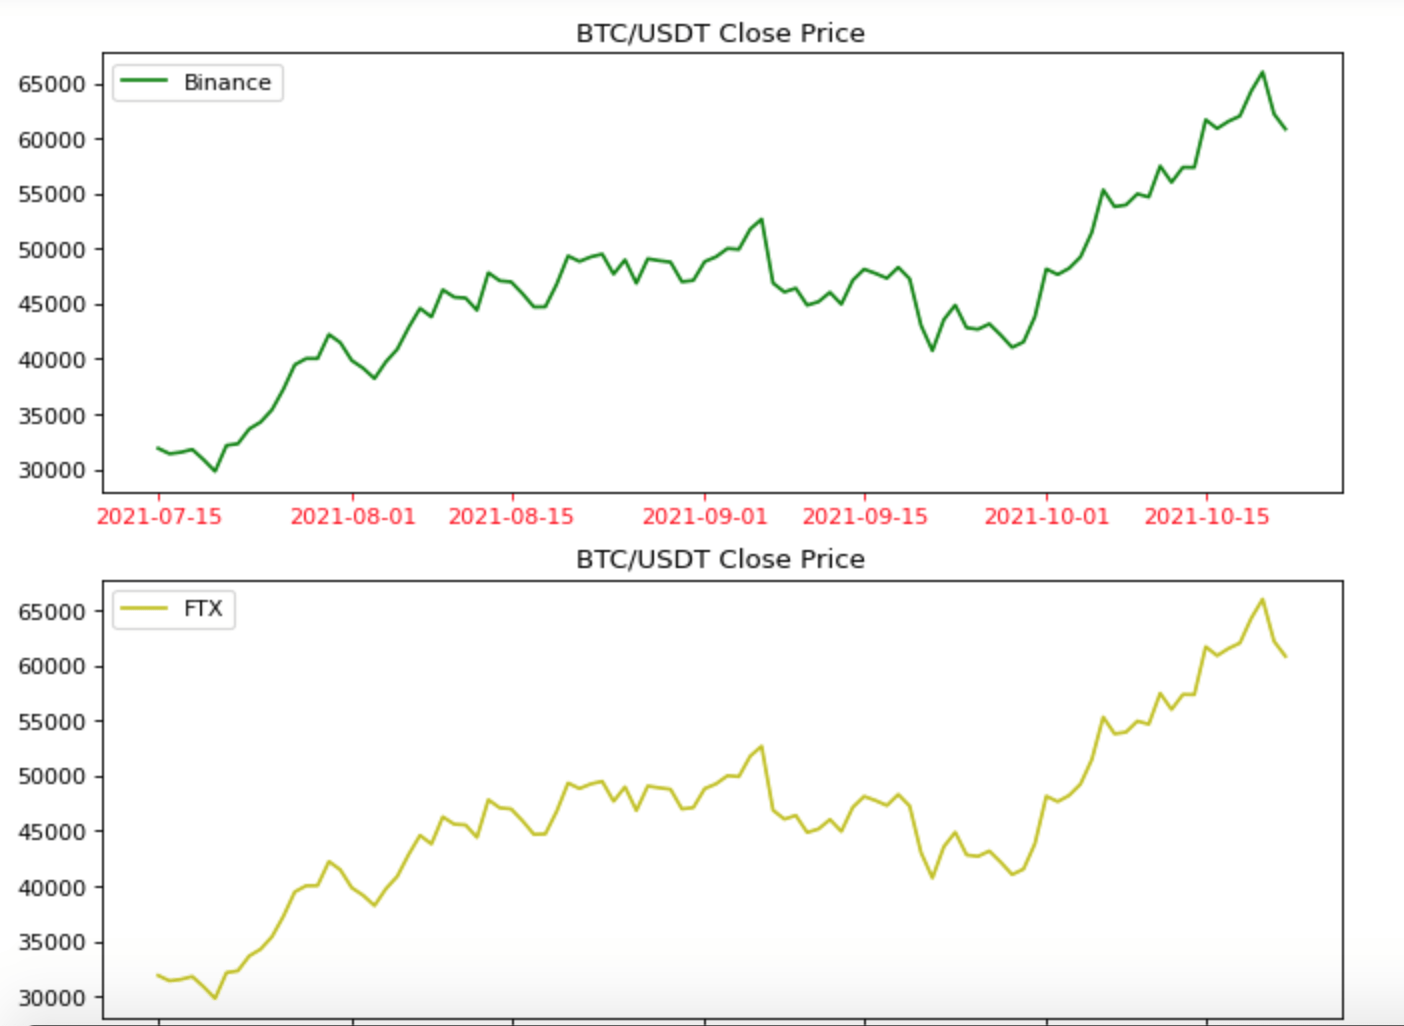
How about Close vs Volume?

Pretty dirty, right? As if a kid sketched something on paper, but then this is called volatility!
Fetching Orderbook
Now let’s pull up the order book from Binance and FTX.
orderbook_binance_btc_usdt = binance.fetch_order_book('BTC/USDT')
orderbook_ftx_btc_usdt = ftx.fetch_order_book('BTC/USDT')

bids_binance = orderbook_binance_btc_usdt['bids']
asks_binanace = orderbook_binance_btc_usdt['asks']

df_bid_binance = pd.DataFrame(bids_binance, columns=['price','qty'])
df_ask_binance = pd.DataFrame(asks_binanace, columns=['price','qty'])
Let’s plot the graph!
fig, (ax1, ax2) = plt.subplots(2, figsize=(10, 8), dpi=80)

ax1.plot(df_bid_binance['price'], df_bid_binance['qty'],label='Binance',color='g')
ax1.fill_between(df_bid_binance['price'], df_bid_binance['qty'],color='g')

ax2.plot(df_ask_binance['price'], df_ask_binance['qty'],label='FTX',color='r')
ax2.fill_between(df_bid_binance['price'], df_bid_binance['qty'],color='r')

ax1.set_title('Ask Price vs Quantity for Binance')
ax2.set_title('Bid Price vs Quantity for Binance')
plt.show()
And it produces…
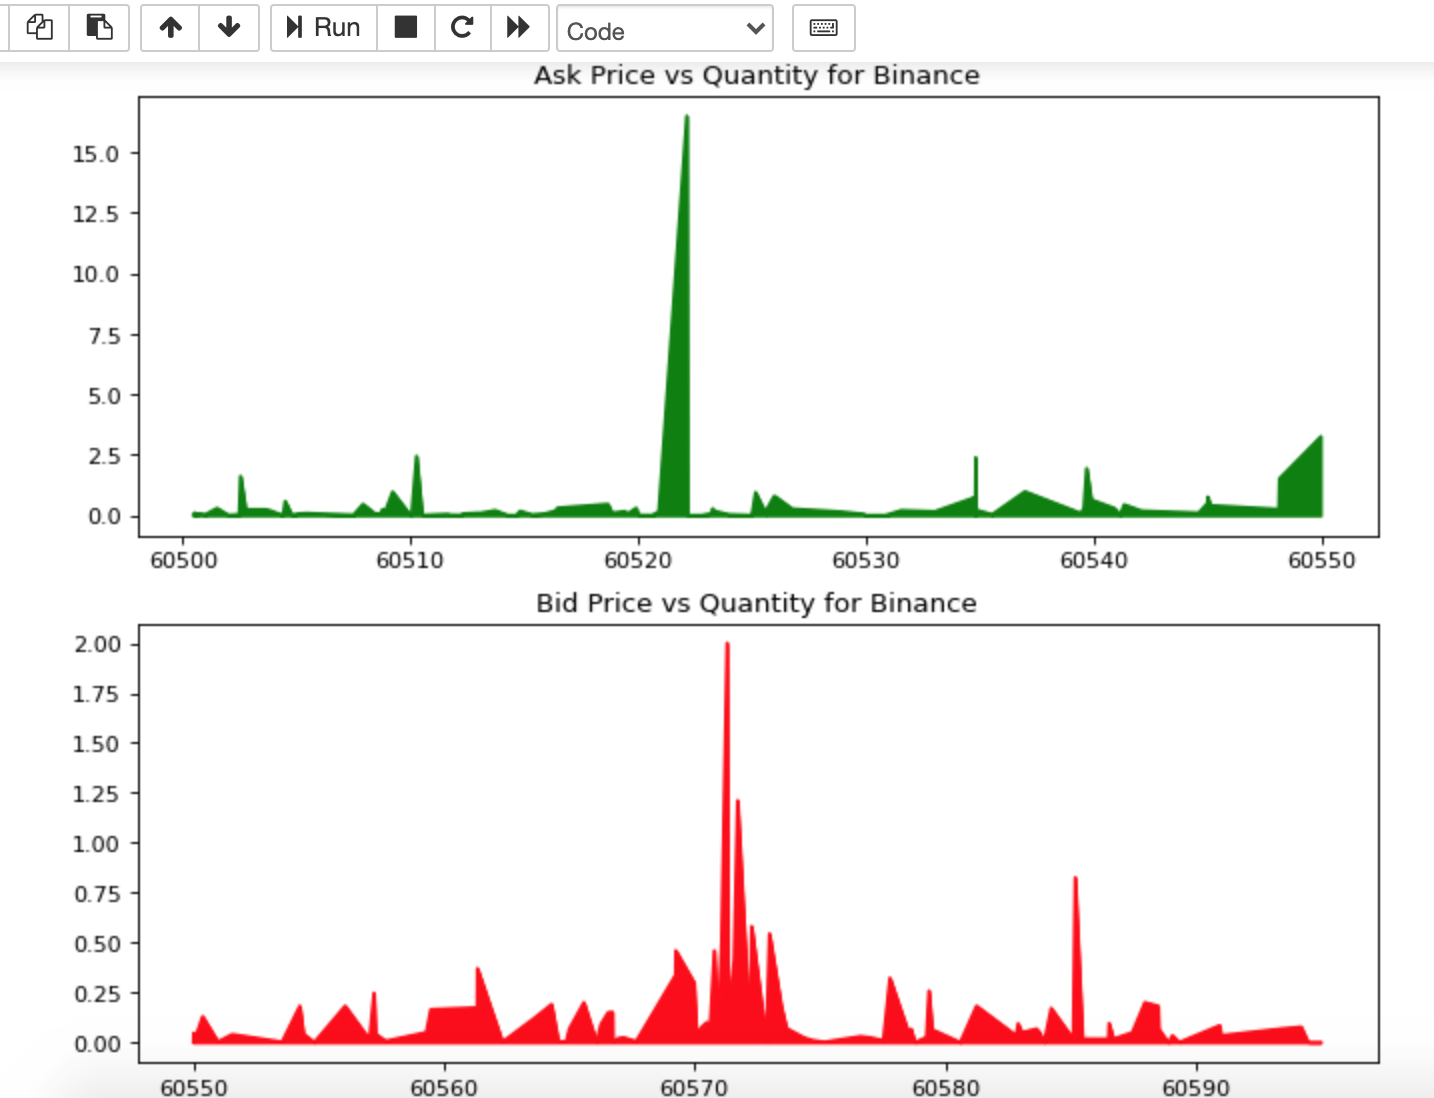
Cool, isn’t it?
Conclusion
So, as you know now, CCXT is a powerful library for working with crypto exchange data in Python. It makes it easier to connect multiple exchanges without making any significant changes in the code and is widely used for trading bots and data analysis.
This was a brief intro to the CCXT library. I just scratched the surface. If you are interested, you may create a trading bot based on this library. Several have done it before. Like always, the code is available on GitHub.