This post is the part of trading series.
In the past, I gave you a brief intro to Ta-Lib and how it can be used in technical analysis, in this post, I am going to discuss how you can RSI indicator to generate buy or sell signals in Python by using the TA-Lib library. Before I write code about the implementation, let’s discuss a bit about signal generation and RSI.
What Are Signals
In the world of trading, signals are cues or indicators that are derived from various kinds of analyses and guide investors on when to buy, sell, or hold shares. They help traders to make informed decisions based on market conditions.
What Is A Technical Indicator
A technical indicator in trading is a tool that helps investors analyze price trends and make decisions. It’s like a financial compass, providing insights into market behavior and helping traders identify potential opportunities or risks.
What Is the RSI Indicator
The RSI (Relative Strength Index) is a momentum oscillator that measures the speed and change of price movements. It ranges from 0 to 100 and is used to identify overbought or oversold conditions in a market. An RSI level below 30 generates buy signals while an RSI level above 70 generates sell signals.
Implementation
We discussed the main terminologies, now let’s write code for generating signals based on RSI values. I already discussed the development setup here so you can refer to the previous article about it. One thing, unlike the earlier article where I used the “yfinance” API, I am using AlphaVantage APIs because for some reason yfinance APIs are not working for me. On the other hand, Alphavantage provides awesome APIs which also have a free version. I am going to use the endpoint that returns the daily data of a given symbol. All you have to do is to register for the free API KEY.
So… the idea is, to get the daily data of a certain stock using AlphaVantage API and then use TaLib’s RSI function to calculate RSI in a pandas dataframe using the default 14-day window. I am using jupyter notebook as it makes things easier. The very first thing is the import of libraries.
# All Imports

from datetime import datetime as dt
import requests
import talib as ta
import pandas as pd
import matplotlib.pyplot as plt
The next thing is using AlphaVantage’s API to get the OHLC data.
def get_daily_ohlc_data(symbol):
    function_name = 'TIME_SERIES_DAILY'
    base_url = 'https://www.alphavantage.co/query?function=TIME_SERIES_DAILY&symbol={}&apikey={}'.format(symbol,API_KEY)
    r = requests.get(base_url)
    data = r.json()["Time Series (Daily)"]
    return data
ohlc = get_daily_ohlc_data("MSFT")
# Convert to DataFrame
df = pd.DataFrame.from_dict(ohlc, orient="index")
# Rename columns
df = df.rename(columns={
"1. open": "open",
"2. high": "high",
"3. low": "low",
"4. close": "close",
"5. volume": "volume"
})
df = df.apply(pd.to_numeric)
df = df.sort_index(ascending=True)
df
The function is pretty simple. Using requests library to call the API and then accessing the relevant dict’s key to fetch OHLC data of Microsoft’s stock. After that, convert the payload into a pandas dataframe. Renaming of columns to make it more readable, after that, I am soring them out in ascending order so that I get the latest records at the bottom. When you do that, you will get something like the below.
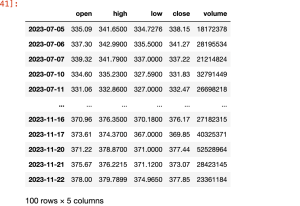
OK, our required dataframe is available, what is left now to calculate RSI
def generate_rsi_signals(data, period=14, overbought_threshold=70, oversold_threshold=30):

    # Calculate RSI
    data['RSI'] = ta.RSI(data['close'], timeperiod=period)

    # Initialize 'Signal' column with 'Neutral'
    data['Signal'] = 'Neutral'

    # Generate signals
    data.loc[data['RSI'] < oversold_threshold, 'Signal'] = 'Buy'
    data.loc[data['RSI'] > overbought_threshold, 'Signal'] = 'Sell'

    return data
In order to calculate RSI, you need to assign a window period, the default value is 14.
In the context of the Relative Strength Index (RSI), the parameter period refers to the number of historical price points used in the calculation. The RSI is a momentum oscillator that measures the speed and change of price movements. The formula for calculating RSI involves comparing the magnitude of recent gains to recent losses over a specified time period.
So, calling TALIb’s RSI function for the period of 14, we add another column in our dataframe, named, RSI
RSI is calculated but things do not end here, the next thing we have to do is to generate signals: Buy, Sell, and Neutral. Then the threshold’s value is to generate buy or sell signals.
df_rsi = generate_rsi_signals(df)
df_rsi.tail(17)
When the above function is called and fetches the last 15 or 17 values, you will get a dataframe like the one below:
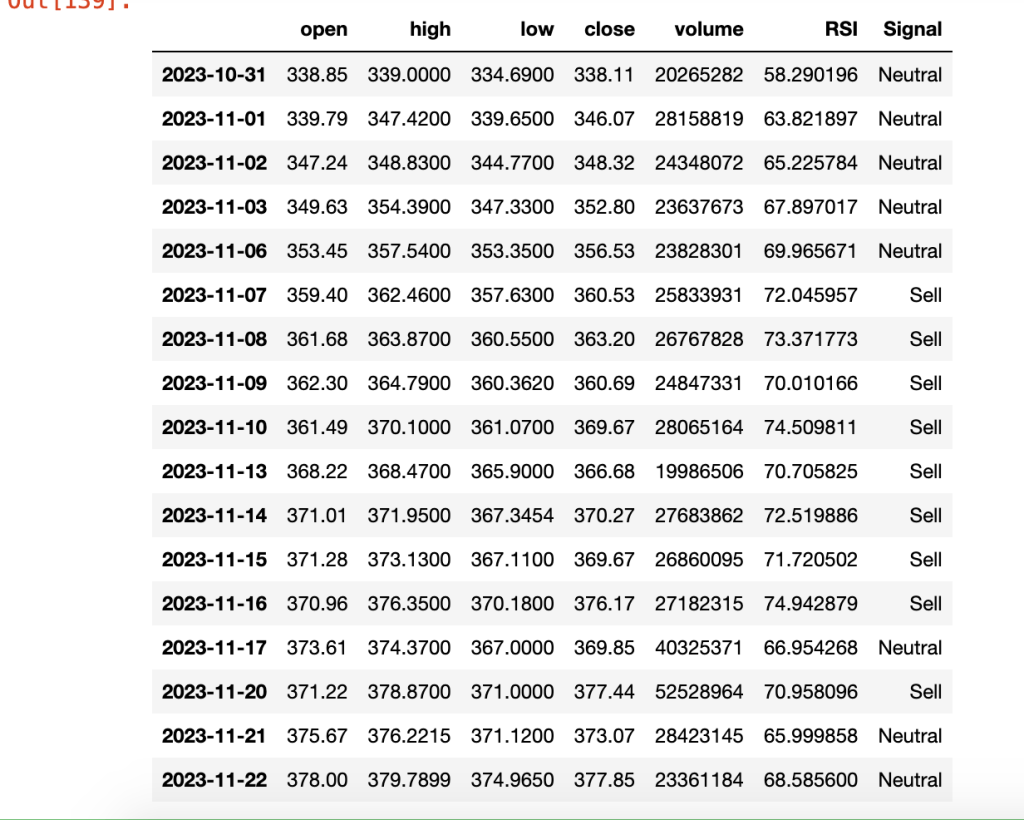
As you can see, it generated different signals over the period of time, it generated a sell signal where the RSI was more than 70 otherwise neutral. Usually, when you create a trading bot that runs all the time during trading hours, you pick the very last value to decide whether you wanna buy, sell, or hold. Here, the very last value is Neutral or hold thus we will not take any action.
Have a winning trading strategy and want it to trade for you automatically, without lifting a finger? I specialize in turning your strategies into fully automated trading bots—whether for stocks, crypto, or forex. Let your strategy work around the clock and maximize your potential. Ready to bring it to life? Email me at kadnan @ gmail.com
Conclusion
In this post, you learned how easily you can access stock data and then calculate RSI for generating buy and sell signals and minting money ????
Like always, the code is available on GitHub.