This post is part of trading series.
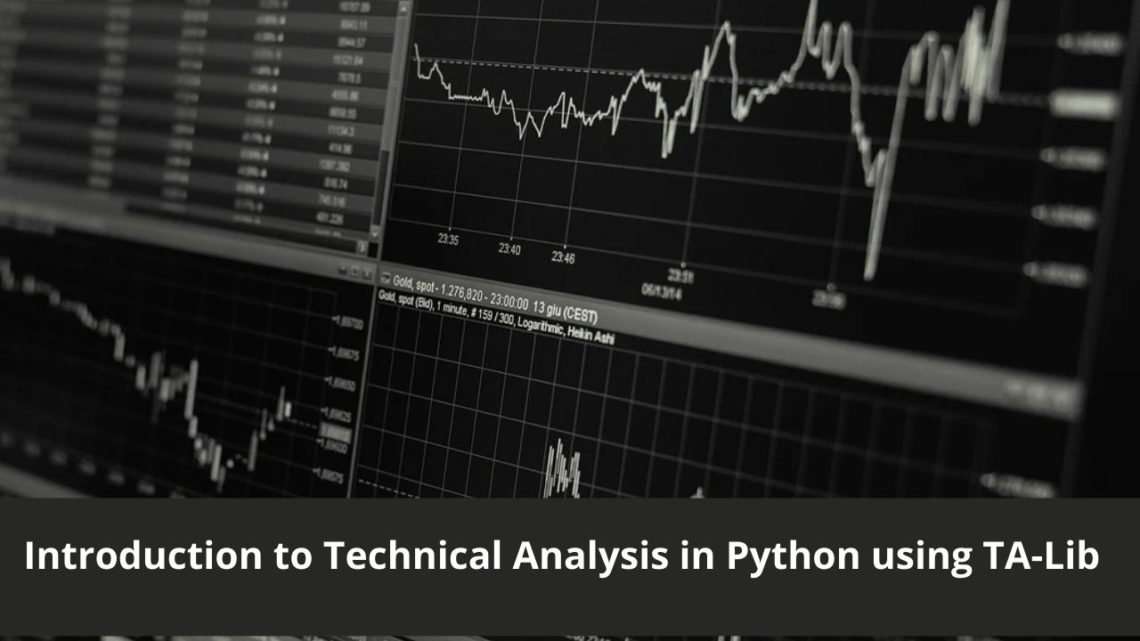
In this tutorial, I am going to discuss TA-Lib, a technical analysis library for Python apps. Before I move on and discuss how you can do technical analysis in Python, allow me to discuss what technical analysis is and how it helps to make a decision about whether you buy an asset, sell it, or hold it.
What is Technical Analysis
From Investopedia:
Technical analysis is a trading discipline employed to evaluate investments and identify trading opportunities by analyzing statistical trends gathered from trading activity, such as price movement and volume.
In short, it is the study of past and current data and trying to figure out what’s going to be next. You use indicators and try to find out different patterns that help to make decisions.
On the other hand, Fundamental Analysis is all about making decisions based on a company’s financials like yearly/quarterly profits, PE Ratios, etc.
Development Setup
Installing the TA-Lib Python wrapper is pretty easy. All are required to execute the pip command:
pip install TA-Lib
You must install the TA-Lib library itself so that you can use it in your applications. On macOS, you may install via Homebrew:
brew install ta-lib
If you are using Linux or Windows then you may get the details here.
I am also installing the Yahoo Finance library to fetch our required data:
pip install yfinance
Alright! So everything is set up. Now before we start using this library, we must know some basics of technical analysis and how TA-Lib can help us to achieve our goals.
I am going to use Yahoo Finance to fetch data and Jupyter Notebook for this tutorial as they make it easy to write interactive code. Use jupyter notebook command to start the IDE and create a new file Analysis Intro.ipynb.
The very first thing I am going to do is to import all required libraries:
# All Imports
import yfinance as yf
import talib as ta
import pandas as pd
We are going to analyze Facebook shares which are already 25% decline, as the article said as millions of users quit FB in recent days.
The very first thing that we are going to check is the Simple Moving Average(SMA) of this scrip.
What is the Moving Average
If you notice the chart of a stock price, you will find it fluctuating a lot. This fluctuation could lead to generating false signals. Moving averages(MA) help to filter out the noise from the random price movements and smooth it out in order to see the average value. MAs are used to identify trends and reversals. When the price is above the MA, we say it’s an uptrend otherwise a downtrend. They are also used to identify areas of support and resistance. MAs are based on past price and is also termed as a lagging indicator. When the price crosses over the MA, it is a signal to buy, and when it crosses down under the MA, it is a signal to sell. There are two types of MAs: Simple and Exponential
- Simple Moving Average:- A simple moving average (SMA) is a calculation that takes the arithmetic mean of a given set of (closing)prices over the specific number of days in the past; for example, over the previous 15, 30, 100, or 200 days (Source: Investopedia).
- Exponential Moving Average:- Exponential moving average (EMA) is a weighted average that gives greater importance to the price of a stock in more recent days, making it an indicator that is more responsive to new information(Source: Investopedia).
If you plot both SMA and EMA on a chart, you will find that the EMA line is pretty close to the actual chart than an SMA because it’s reacting faster than an SMA. This is the reason that SMA is considered a lagging indicator. MAs are available for different time periods: 10,20,500,100,200. 10-20 for short-term trends, 50 for mid-term, and 200 for long-term trends.
Enough discussion of MA background, let’s write some code!
First, I will be fetching FB stock price data from the beginning of the year to date.
# Facebook Historial Data
fb = yf.Ticker("FB")
df = fb.history(start="2022-01-03")
df
The data is now available in a pandas dataframe, let’s plot a graph showing data about the closing price and the SMA of the closing price
plt.style.use('fivethirtyeight')
df['MA'] = ta.SMA(df['Close'],timeperiod=5)
df[['Close','MA']].plot(figsize=(8,8))
plt.show()
When I execute the code in the notebook, it generates the following:
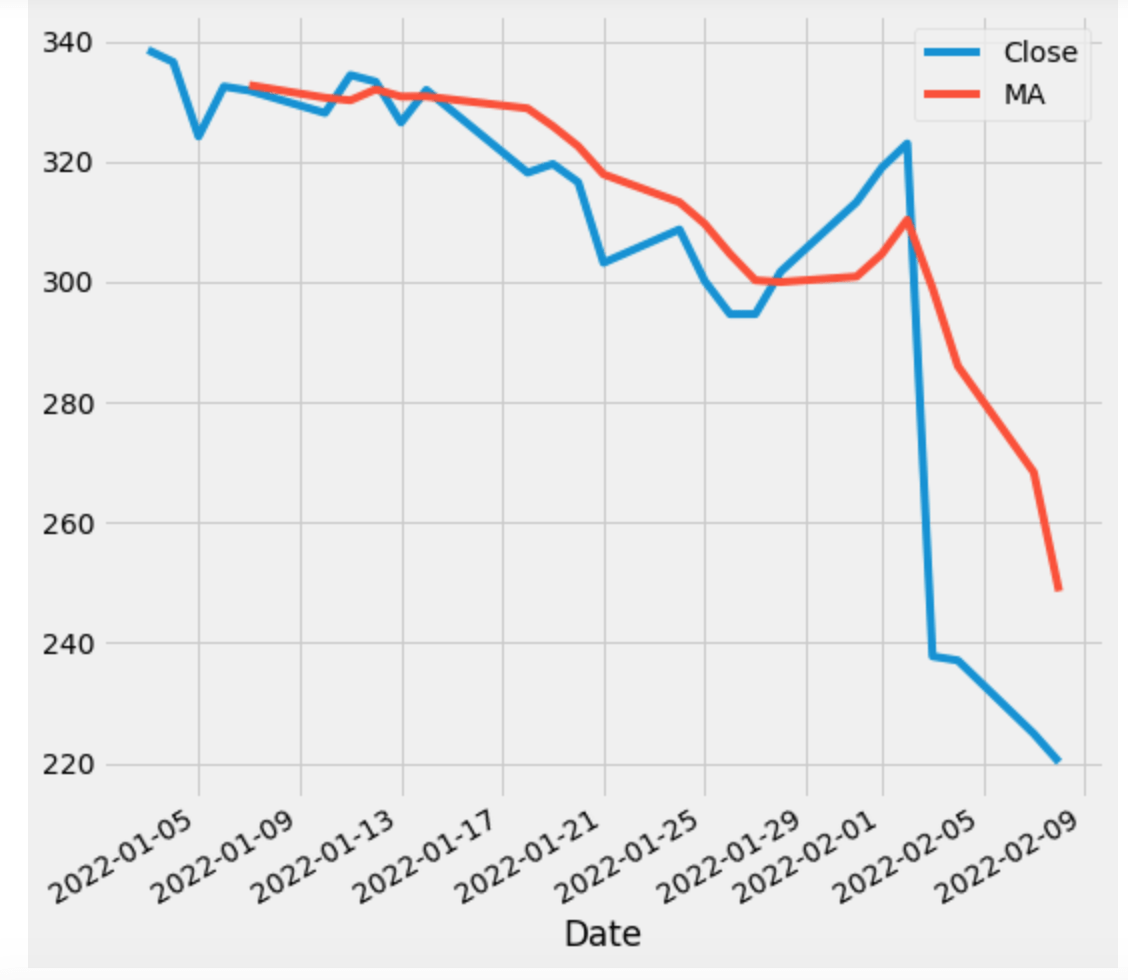
As you can see, unlike the closing chart, the SMA chart is smoother.
Let’s add an EMA chart to it.
plt.style.use('fivethirtyeight')
df['MA'] = ta.SMA(df['Close'],timeperiod=5)
df['EMA'] = ta.EMA(df['Close'], timeperiod = 5)
df[['Close','MA','EMA']].plot(figsize=(8,8))
plt.show()
And when I run this code, the chart looks like the below:
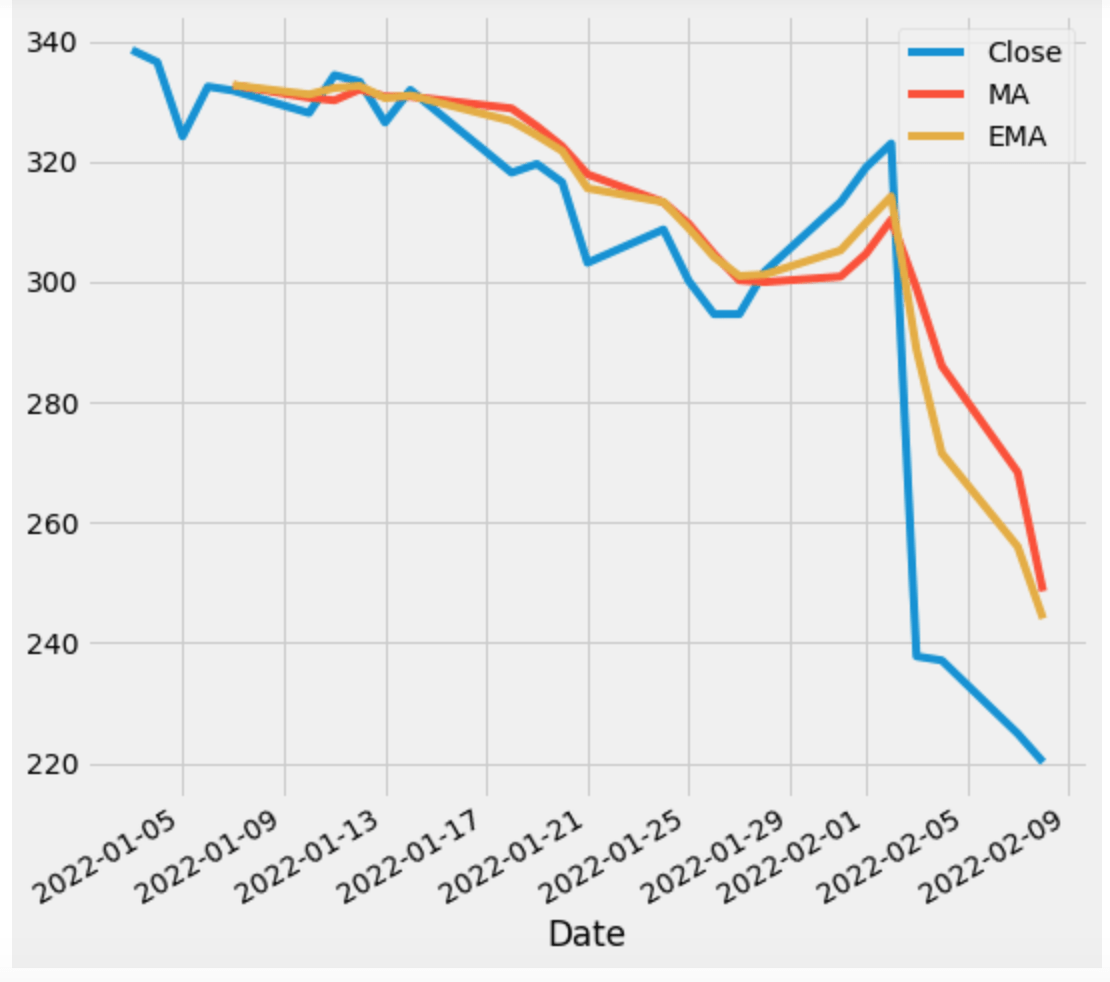
As you can notice, the MA chart is responding slower than the EMA chart, it determines the downtrend slower than the EMA chart.
What is the Relative Strength Index(RSI)
RSI is a momentum indicator that helps to learn whether a certain share is overbought or oversold. Its value lies between 0-100. If it is under 30, it means it is oversold, and has a chance to buy it. If the value lies above 70, it means it is overbought and it is a good chance to dump your stock. Let’s calculate and chart the RSI of the FB/Meta stock. Let’s check the RSI of FB.
# RSI
df['RSI'] = ta.RSI(df['Close'],14)
df['RSI'].plot(figsize=(8,8),marker='o')
df.tail(10)
And it produces. 14 is the default period where it is calculated.
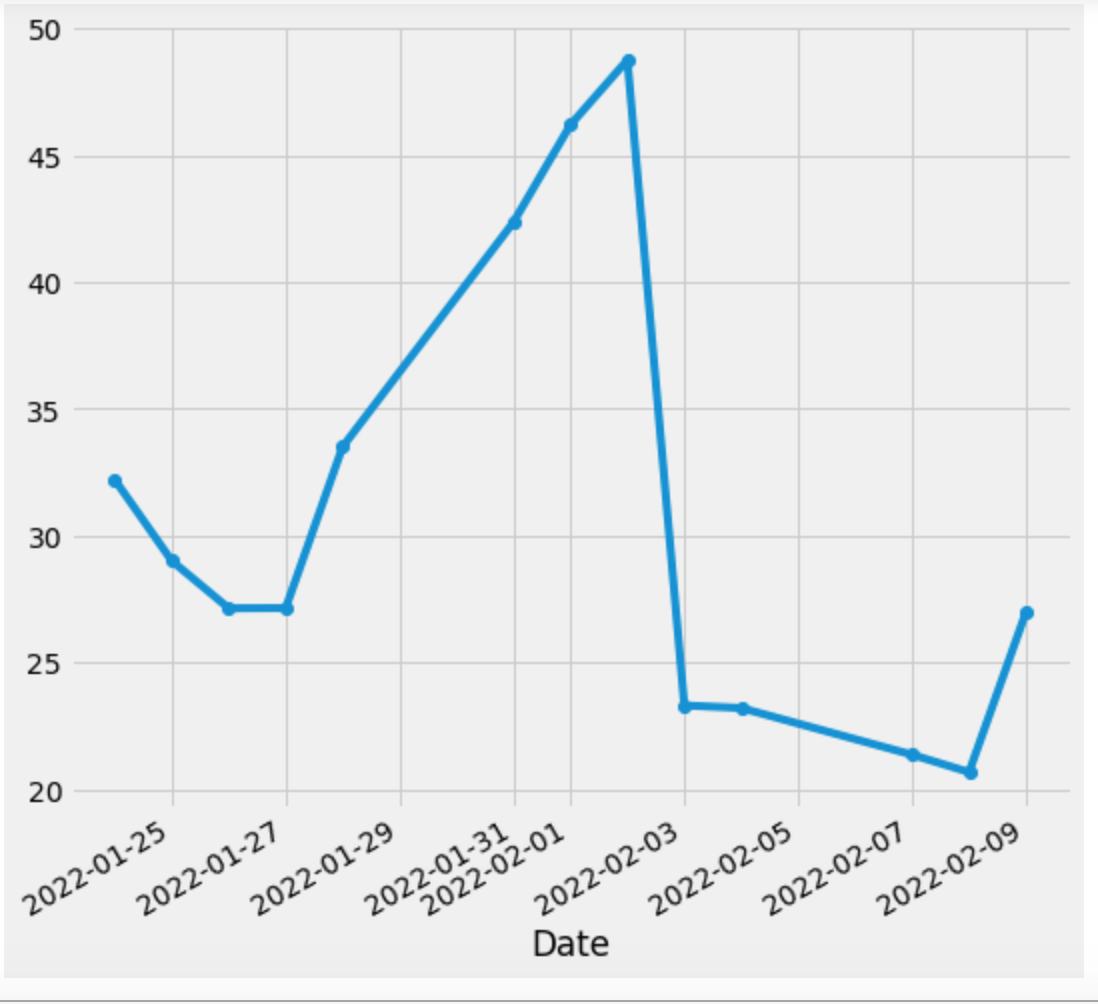
As you can see, there was a big rally between 1 and 2 Feb and then it was dumped badly between 3 to 9 Feb and it seems it is trying to recover again.
Conclusion
In this tutorial, we learned how you can use TA-Lib and charts to figure out your next trading strategy. It is not possible to cover everything related to TA-Lib in this post but I hope it gives you an idea of what to do next. You may create a bot that checks RSI values and gives signals periodically. Like always, the code is available on Github.
If you are interested in knowing how to generate buy and sell signals using the RSI indicator then click here.
Do you have some profitable strategy that you want to automate that trade on your behalf without any intervention? I can help you in this regard. Whether it’s a stock bot, crypto bot, or forex, I can write the code to run and trade based on your strategy. Contact me at kadnan @ gmail.com