This post is part of the T4p Series.
In the previous post, I discussed the Hammer Pattern. So far, we have been writing everything from scratch to detect a certain pattern. However, there’s an amazing library available that has done all the heavy lifting on our behalf and provides easy-to-use interfaces to detect patterns. I will be using the pandas-ta library for this purpose. For certain patterns, it relies on the TA-Lib library, a C++ library for technical analysis.
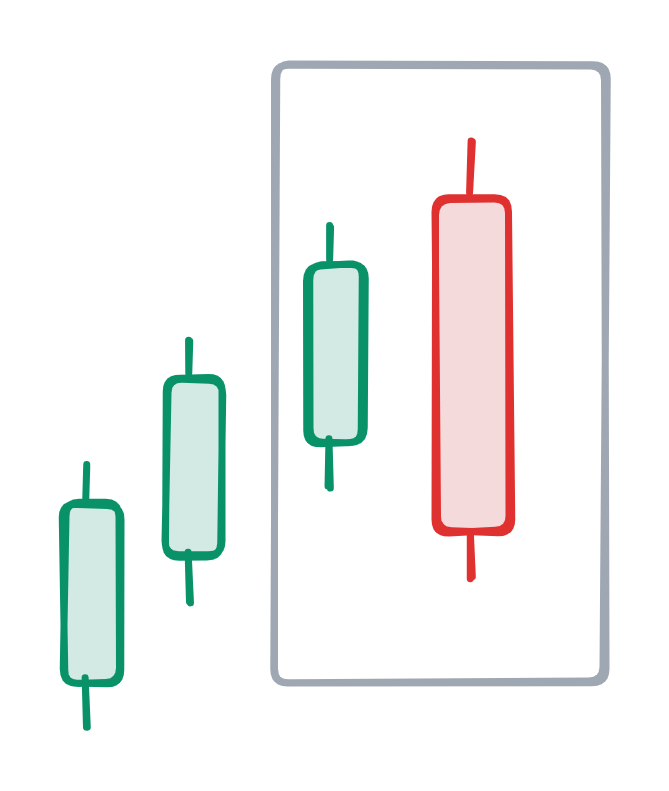
What Is The Engulfing Pattern

The Engulfing Pattern is a two-candle pattern that hints at a possible reversal in price direction. It consists of two candlesticks:
- Bullish Engulfing Pattern: This pattern shows up when prices have been falling for a while. It gives us a hint that prices might start climbing instead. First, we see a small red candle. This tells us that sellers were winning, pushing prices down. Then comes a bigger green candle that completely covers up (or “engulfs”) the red one. This means buyers suddenly came in with more power than the sellers had. When traders spot this pattern, they think, Hmm, it looks like buyers are taking over now. Prices might keep going up from here. Think of it like a tug-of-war: The sellers were winning (red candle), but then the buyers arrived with reinforcements and pulled hard enough (green candle) to not only make up the lost ground but gain even more. This sudden shift in strength suggests that the buyers might continue to have the advantage going forward.
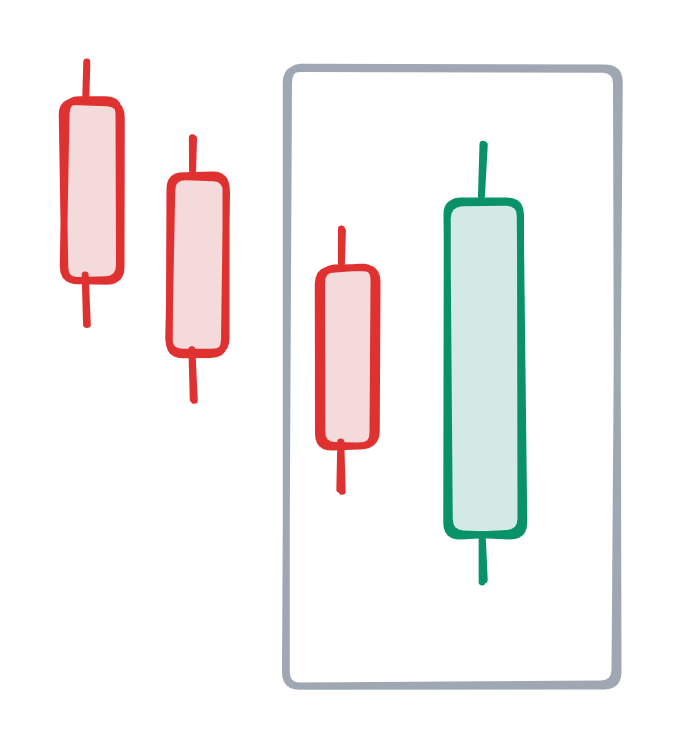
- Bearish Engulfing Pattern: This pattern shows up when prices have been climbing for a while. It signals that prices might start falling instead. First, we see a small green candle. This tells us that buyers were winning, pushing prices up. Then comes a bigger red candle that completely covers up (or “engulfs”) the green one. This means sellers suddenly came in with much more power than the buyers had. When traders spot this pattern, they think, “Looks like sellers are taking over now. Prices might keep going down from here.” Think of it as a crowded elevator going up. Initially, more people were getting on (buyers pushing the price up – green candle). But then suddenly, many more people want to get off than get on (sellers overwhelming buyers – red candle). This sudden shift suggests that the downward movement might continue as more people decide to exit. This reversal pattern is particularly significant because it shows a complete shift in market sentiment – from optimism (buyers in control) to pessimism (sellers taking over) – happening in just two trading periods.
Usage
The Engulfing Pattern is used to identify potential market trend reversals. Traders often use it as an entry or exit signal, confirming it with other indicators like volume or moving averages for better accuracy.
Development
Visualization
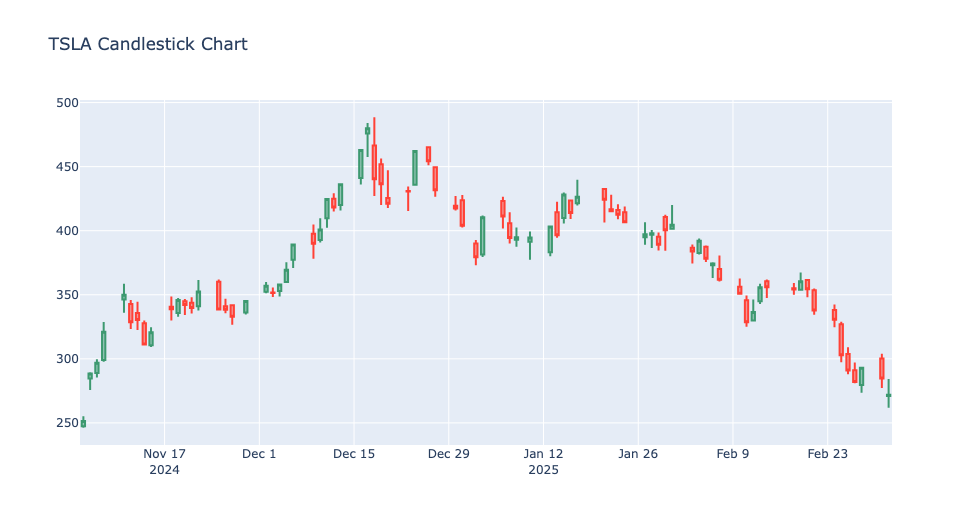
Like before, the first thing we will do is write code for visualizing the pattern itself. Assuming all the required libraries are installed (discussed multiple times in previous posts), I’m going to use ChatGPT to generate fictitious OHLC data tailored to my requirements. I am pulling TSLA data by using the Yfinance library. Make sure you have the latest version installed, as older versions lesser than .53 does not work anymore.
def get_tsla_recent_data():
    session = requests.Session()
    session.headers.update({'User-Agent': 'Mozilla/5.0 (Windows NT 10.0; Win64; x64) AppleWebKit/537.36 (KHTML, like Gecko) Chrome/58.0.3029.110 Safari/537.3'})
    tsla = yf.Ticker('TSLA', session=session)
    df = tsla.history(period='4mo', interval='1d')
    return df
I am using Plotly interactive charts for this purpose.
def visualize_interactive(df, title="TSLA Candlestick Chart"):
    """
    Plots an interactive candlestick chart using Plotly.

    Parameters:
    df (pd.DataFrame): The DataFrame containing OHLC data.
    title (str): The title of the chart.
    """
    fig = go.Figure(data=[go.Candlestick(
        x=df.index,
        open=df['Open'],
        high=df['High'],
        low=df['Low'],
        close=df['Close'],
        name='TSLA'
    )])

    fig.update_layout(title=title, xaxis_rangeslider_visible=False)
    fig.show()
And then you call it like the below:
tsla_data = get_tsla_recent_data()
visualize_interactive(tsla_data)
When you run it, it produces a chart like the one below:
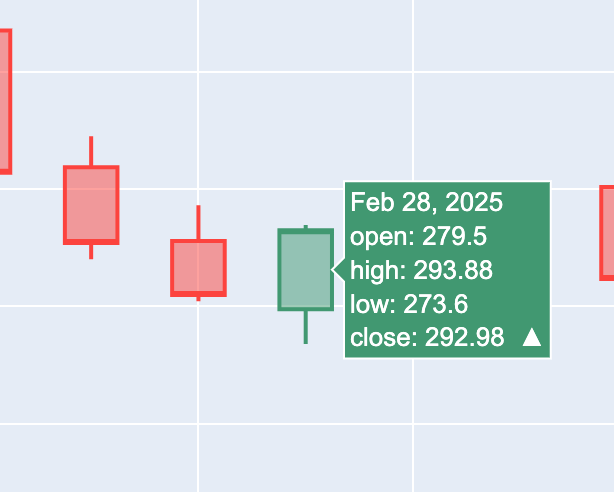
So, how do you identify an Engulfing Candle? It’s pretty simple:
- The body (open-to-close range) of the engulfing candle must be larger than the body of the previous candle. This means it completely covers the previous candle’s real body, but wicks (highs and lows) don’t matter in this pattern.
- The engulfing candle should have the opposite color of the previous candle:
- If the previous candle is red (bearish, selling pressure), the engulfing candle must be green (bullish, buying pressure).
- If the previous candle is green (bullish), the engulfing candle must be red (bearish) to signal a reversal.
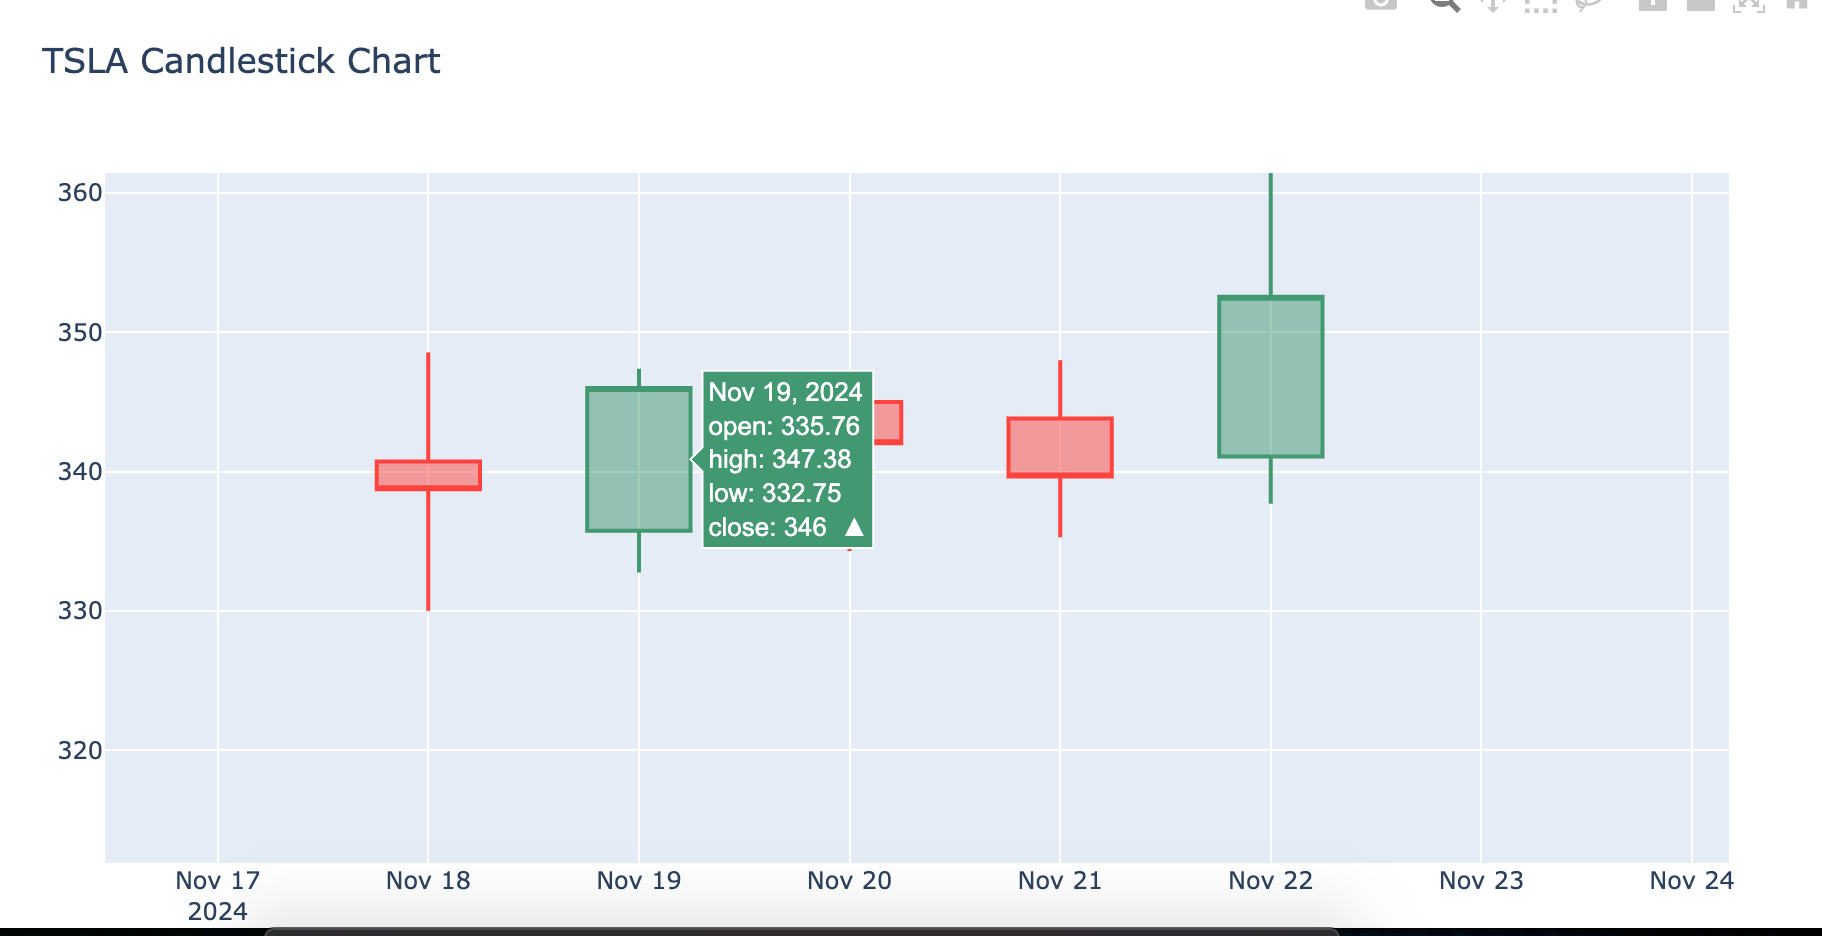
Look at the image above. The candle on November 19th is an Engulfing Candle because it is green (bullish), while the previous candle is red (bearish), indicating a potential trend reversal. Its body (open-to-close range) is also larger than the last red candle’s body, fully engulfing it. This confirms a Bullish Engulfing Pattern, suggesting a possible shift to an upward trend.
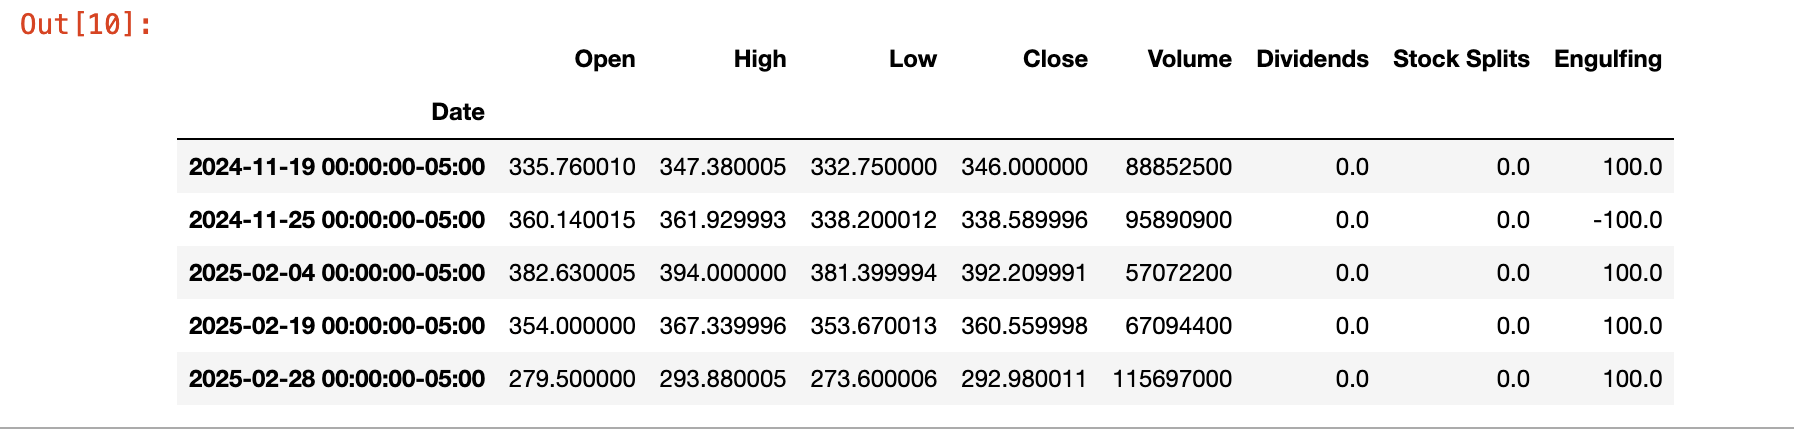
Alright, so we can visualize and detect an engulfing candle, but how’d we figure it programmatically? We are going to use pandas-ta‘s cdl_pattern for this purpose. Actually, this function belongs to the TA-Lib library, and pandas-ta has just provided a wrapper for it. Below is the function that detects the engulfed candles.
def detect_engulfing_pattern(tsla_df):
    tsla_df['Engulfing'] = ta.cdl_pattern(tsla_df['Open'], tsla_df['High'], tsla_df['Low'], tsla_df['Close'], name="engulfing")
    return tsla_df
and then you call it like this:
engulfing_patterns = detect_engulfing_pattern(tsla_data)
When you run this code, it displays a dataframe like the below:
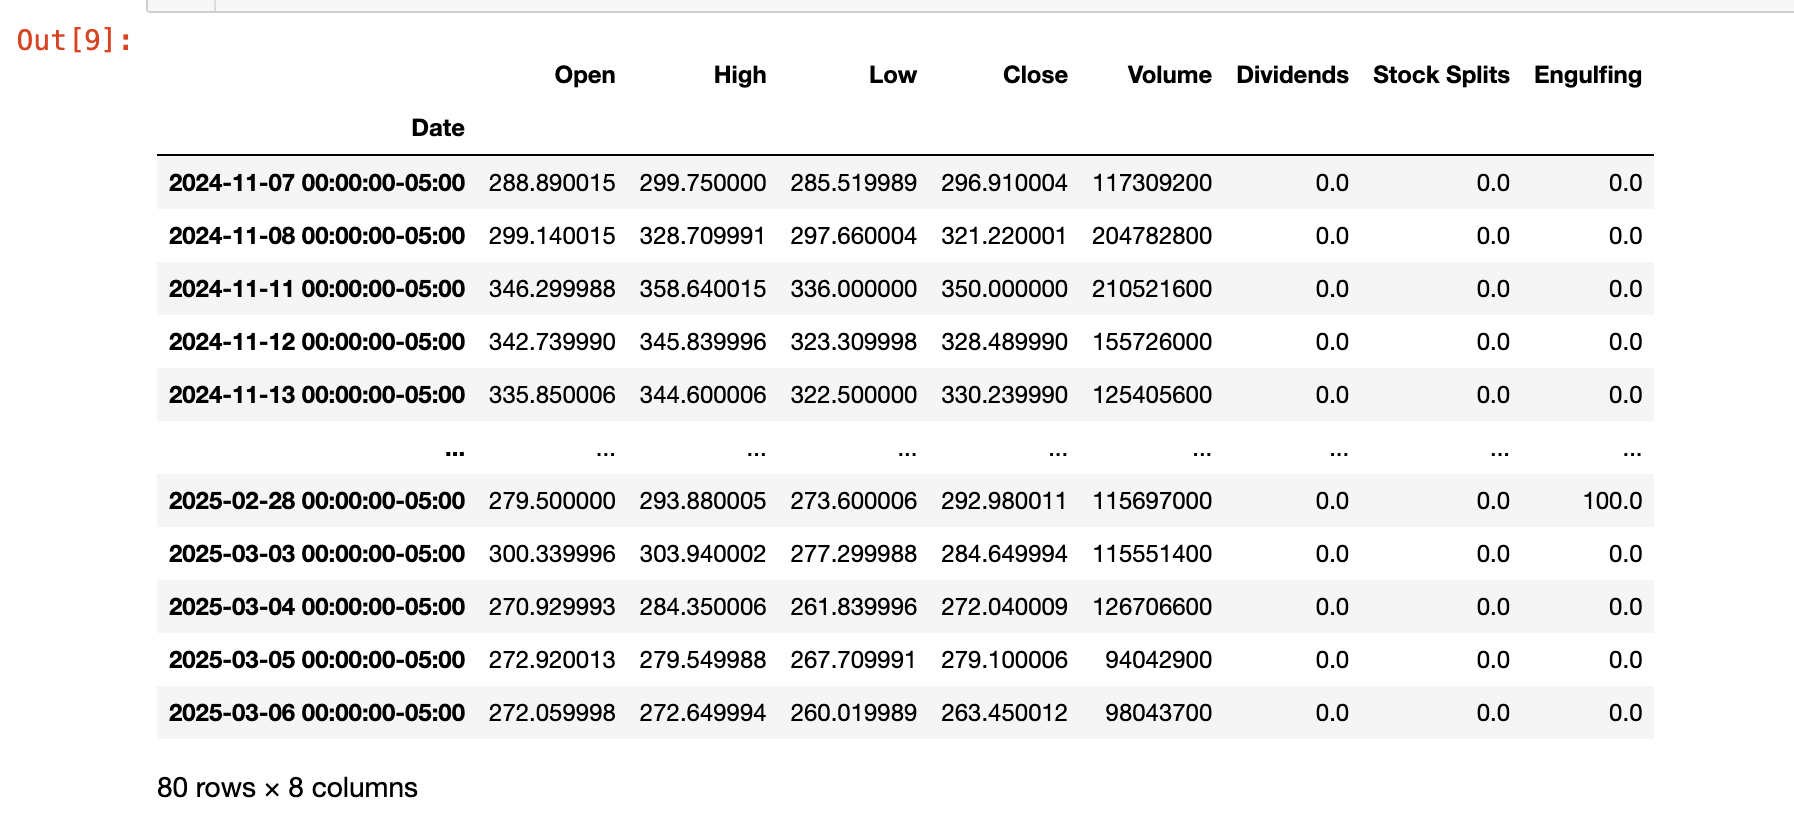
On 28th Feb, you see the value it returned is 100. 100 means bullish engulfing, and -100 means bearish engulfing. We can confirm it visually on the graph.
The code above displays all values, including non-engulfing candles. To focus only on the relevant entries, we can filter the DataFrame to show only the rows where an engulfing pattern has emerged.
engulfing_df = engulfing_patterns[engulfing_patterns['Engulfing'] != 0]
engulfing_df
This dataframe now prints only those entries where engulfing pattern emerged.
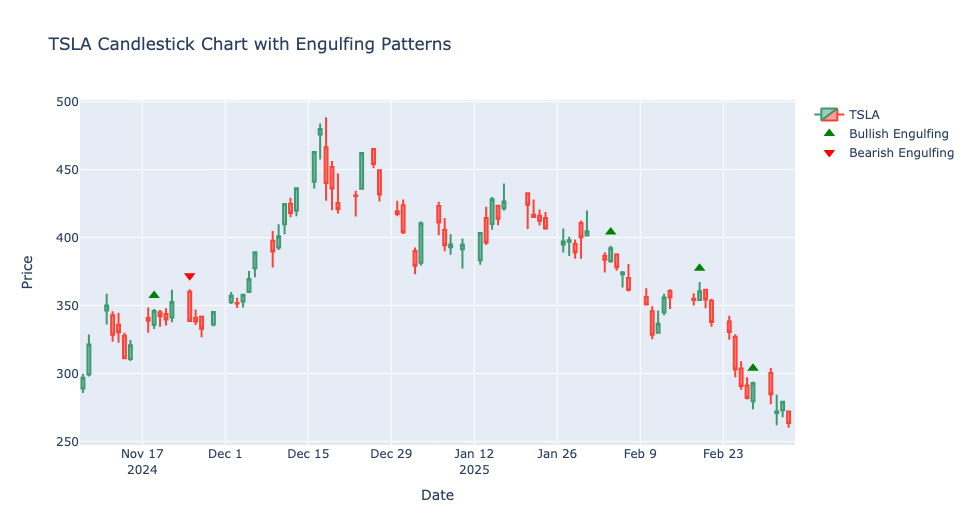
Before I conclude, how about we give a kind of some hints about engulfing candles?
def visualize_engulfing_pattern(tsla_df):
    # Create the candlestick chart
    fig = go.Figure(data=[go.Candlestick(
        x=tsla_df.index,
        open=tsla_df['Open'],
        high=tsla_df['High'],
        low=tsla_df['Low'],
        close=tsla_df['Close'],
        name='TSLA'
    )])

    # Highlight Engulfing Patterns
    engulfing_candles = tsla_df[tsla_df['Engulfing'] != 0]

    # Separate Bullish and Bearish Engulfing Patterns
    bullish_engulfing = tsla_df[tsla_df['Engulfing'] == 100]
    bearish_engulfing = tsla_df[tsla_df['Engulfing'] == -100]

    # Mark Bullish Engulfing Patterns (Green Triangle-Up)
    fig.add_trace(go.Scatter(
        x=bullish_engulfing.index,
        y=bullish_engulfing['High']+10,
        mode='markers',
        marker=dict(size=10, color='green', symbol='triangle-up'),
        name='Bullish Engulfing'
    ))

    # Mark Bearish Engulfing Patterns (Red Triangle-Down)
    fig.add_trace(go.Scatter(
        x=bearish_engulfing.index,
        y=bearish_engulfing['High']+10,
        mode='markers',
        marker=dict(size=10, color='red', symbol='triangle-down'),
        name='Bearish Engulfing'
    ))

    # Chart Layout
    fig.update_layout(
        title="TSLA Candlestick Chart with Engulfing Patterns",
        xaxis_title="Date",
        yaxis_title="Price",
        xaxis_rangeslider_visible=False
    )

    # Show the figure
    fig.show()
When you run this code, it generates a graph that includes red and green markers. The red markers indicate Bearish Engulfing Patterns, while the green markers highlight Bullish Engulfing Patterns, making it easy to spot potential trend reversals on the chart.
Conclusion
In this post, I introduced the pandas-ta library, which saves you from writing custom code for pattern detection and technical indicators. With this library, you can easily create a Python script that identifies engulfing candles and generates trading signals. As always, the code is available on GitHub
Looking to create something similar or even more exciting? Schedule a meeting or email me at kadnan @ gmail.com.
Love What You’re Learning Here?
If my posts have sparked ideas or saved you time, consider supporting my journey of learning and sharing. Even a small contribution helps me keep this blog alive and thriving.