In last post I covered line graph. In this post I am going to show how to draw bar graph by using Matplotlib.
Bar Graph
What is bar graph? According to Wikipedia
A bar chart or bar graph is a chart or graph that presents categorical data with rectangular bars with heights or lengths proportional to the values that they represent. The bars can be plotted vertically or horizontally.
So in short, bar graphs are good if you to want to present the data of different groups that are being compared with each other.
For this post I have picked the data of movies genres released from 1995-2017. The source of data is here.
import matplotlib.pyplot as plt
import numpy as np

label = ['Adventure', 'Action', 'Drama', 'Comedy', 'Thriller/Suspense', 'Horror', 'Romantic Comedy', 'Musical',
         'Documentary', 'Black Comedy', 'Western', 'Concert/Performance', 'Multiple Genres', 'Reality']

no_movies = [
    941,
    854,
    4595,
    2125,
    942,
    509,
    548,
    149,
    1952,
    161,
    64,
    61,
    35,
    5
]
I take two lists, label and no_movies and put the respective data into it.
index = np.arange(len(label))
arange is numpymethod that generates an array of sequential numbers. For instance numpy.arange(5) will generate a numpy.ndArray like [0,1,2,3,4,5]
Why is it needed? We need some data for X-axis and right now we only have labels that can’t be used for plotting purpose. So we will generate an array of length of label and use it on X-axis. Code for the graph is given below:
def plot_bar_x():
    # this is for plotting purpose
    index = np.arange(len(label))
    plt.bar(index, no_movies)
    plt.xlabel('Genre', fontsize=5)
    plt.ylabel('No of Movies', fontsize=5)
    plt.xticks(index, label, fontsize=5, rotation=30)
    plt.title('Market Share for Each Genre 1995-2017')
    plt.show()
you see for xticks I used both index and label. Labels will be placed on each tick that is generated due to index sequence. I also give a bit of room for x-Axis labels by rotating them. When run something like below will be generated.

You can also generate a horizontal bar graph. You will need to use barh method.
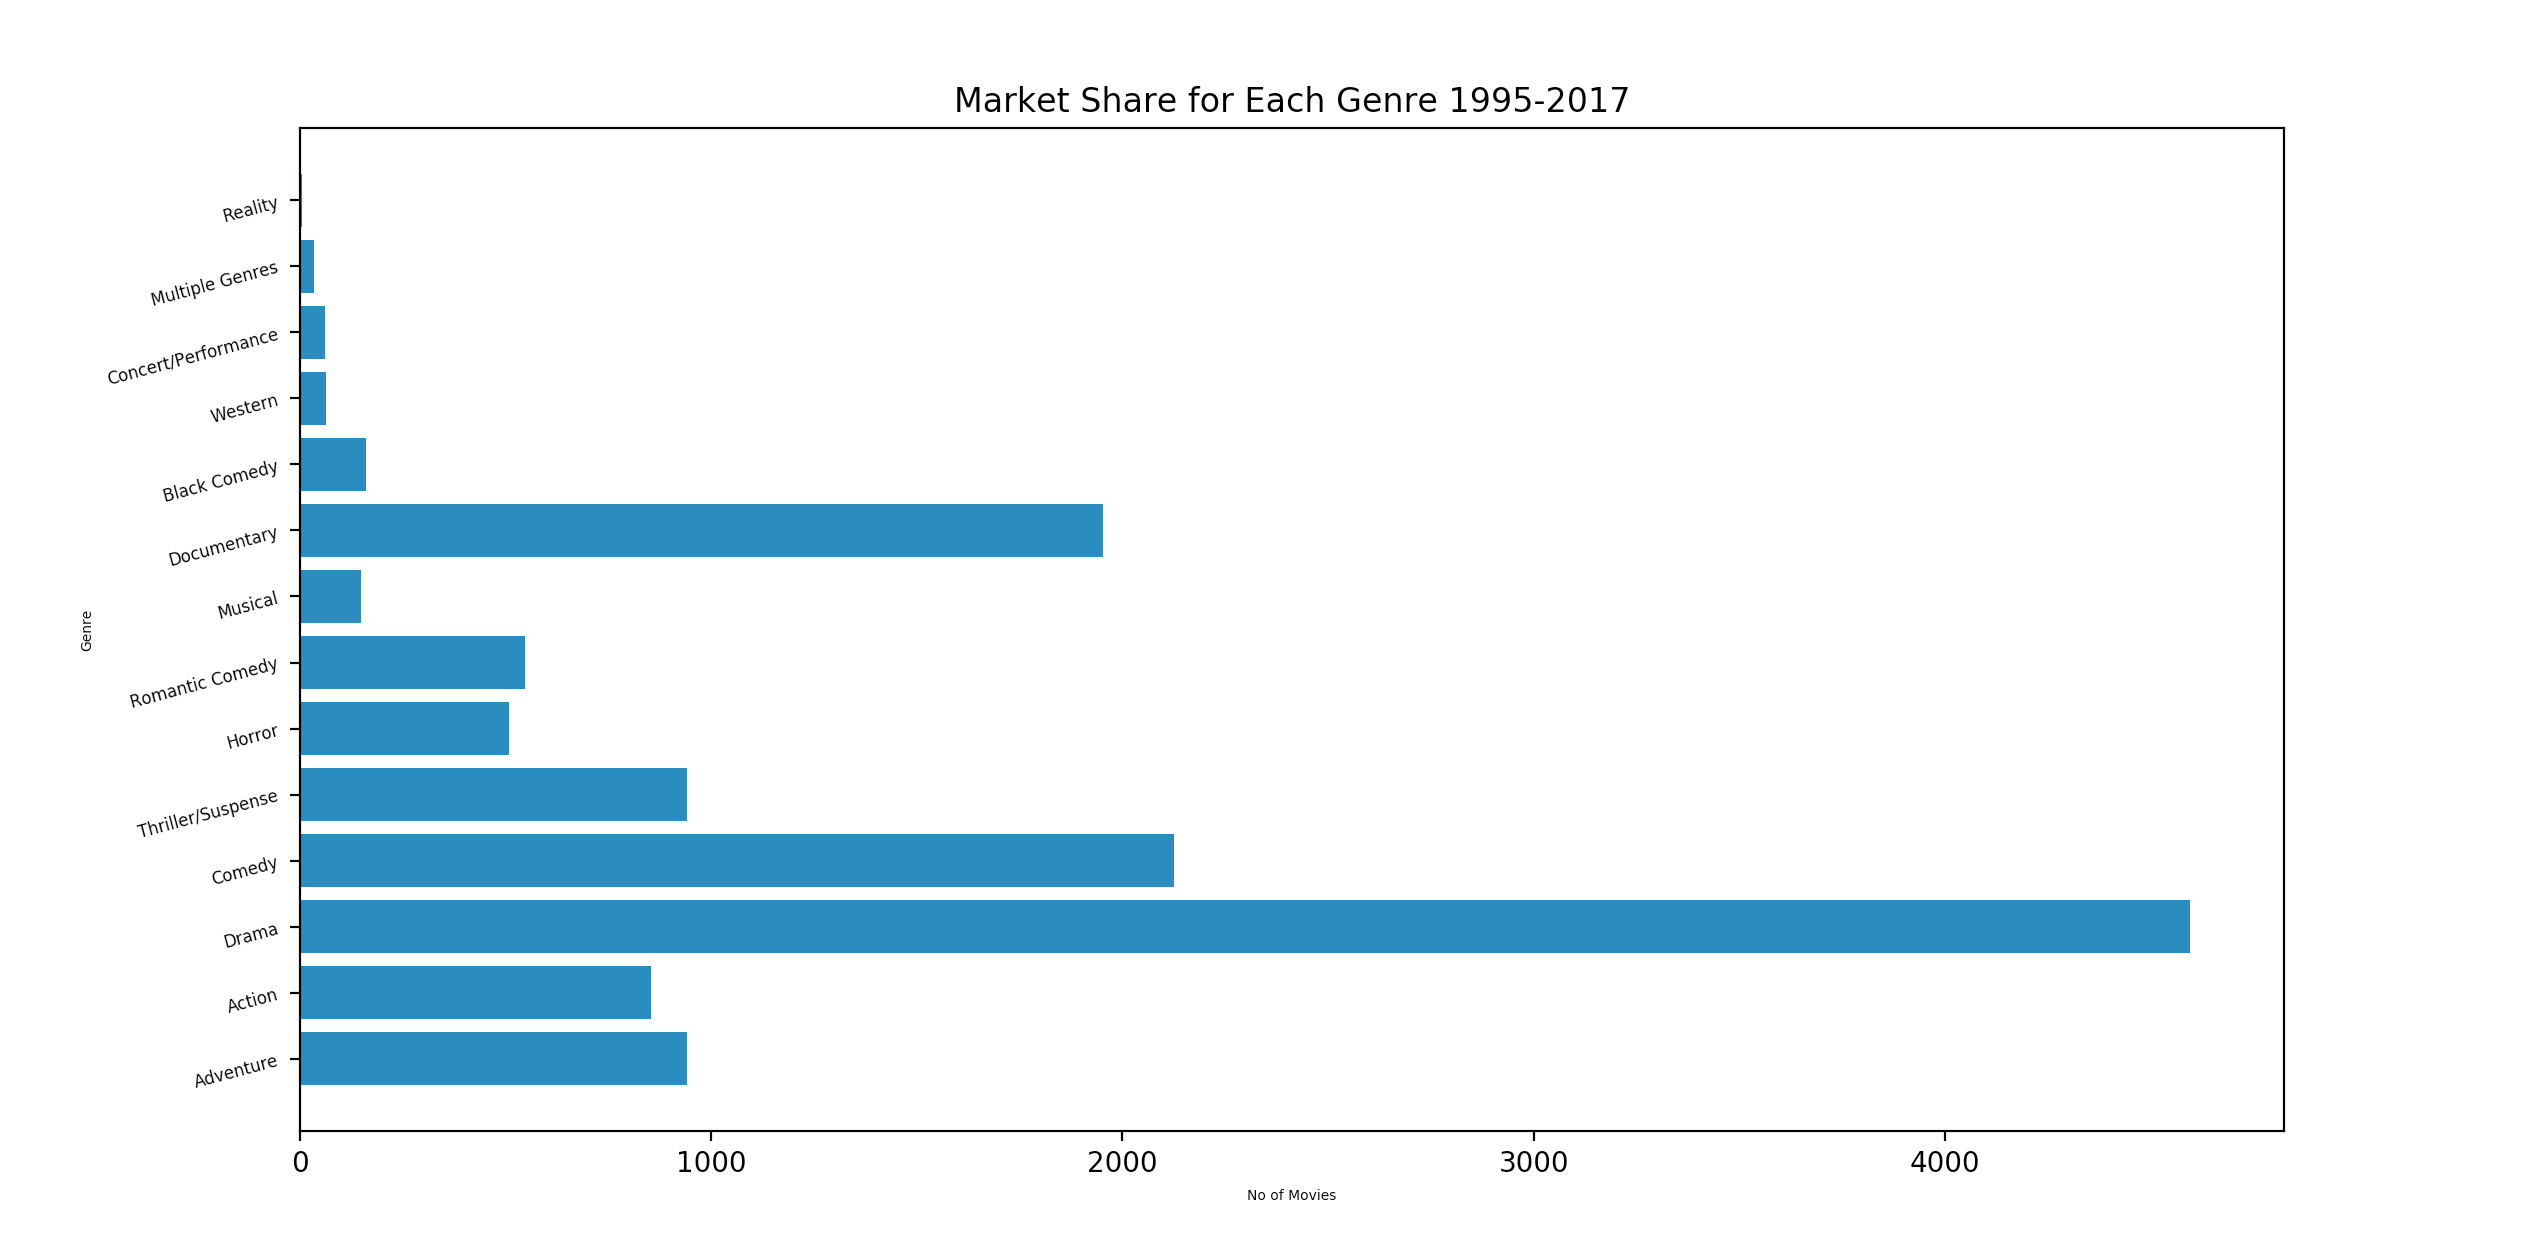
The graph tells that more movies released in Drama genre than Comedy. Though it should be inverse as the world more happy and positive things than sad/emotional one.
That’s it for now. In coming post I will be covering histogram graph.