OHLC data is often visualized using candlestick charts, where each candlestick represents an OHLC entry for a chosen timeframe. Traders commonly use timeframes like 1 minute, 5 minutes, 15 minutes, 30 minutes, 1 hour, 4 hours, daily, weekly, or monthly. The choice of timeframe depends on the trader’s strategy—whether they are looking for short-term trades or planning to hold their position for months or even years. These timeframes help traders make informed decisions on when to enter or exit a trade based on their goals.
OHLC Data Presentation
Reading OHLC data as it is is not an easy task therefore traders depend on a type of chart called OHLC Chart. Each entry on that chart is called a candlestick. Each candle represents a price range, that is: what was the opening price, how high it went, how much it decreased, and at what price it was closed, in a given timeframe.
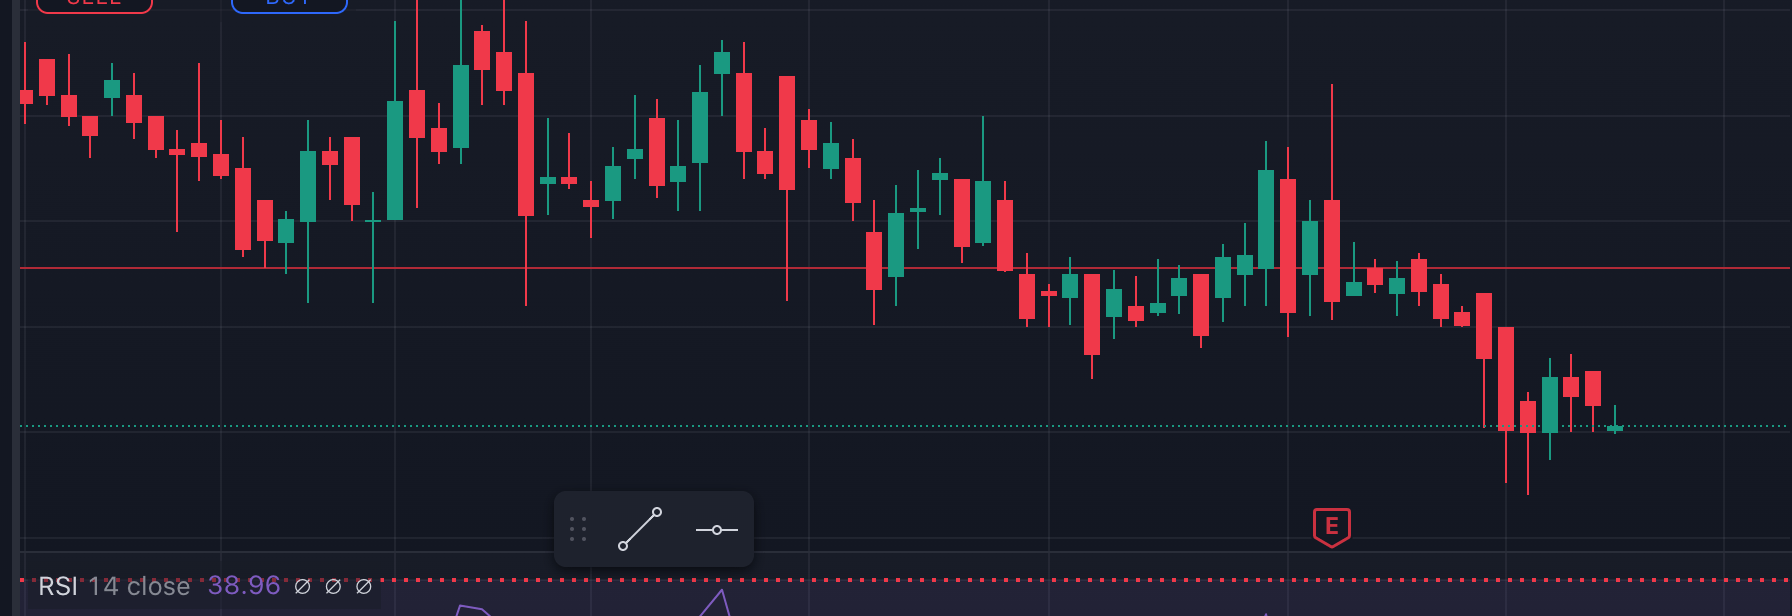
In the chart above, you’ll notice two types of candles: bullish and bearish. A bullish candle forms when the closing price is higher than the opening price, indicating upward momentum. In contrast, a bearish candle forms when the closing price is lower than the opening price, signaling a price decline.
In this chart, green represents a bullish candle, and red represents a bearish candle. However, these colors aren’t standardized—some charts may use white and black, where black represents a bearish candle. You might also come across hollow candles, but they all represent the same concept: showing price movement within a given timeframe. The choice of color or style is just a matter of preference.
Why OHLC Data is Important
OHLC data is like a cheat sheet for traders and analysts, offering a snapshot of how an asset’s price moves within a specific timeframe. OHLC data is key for spotting trends in the market. For instance, if the closing price consistently goes higher than the opening price over several timeframes, it might signal an upward trend, indicating that more buyers are pushing the price up.
OHLC data also helps traders identify entry and exit points. If you notice that the price has dropped significantly (the Low), but then closes higher, you might consider entering a trade because the asset could be gaining strength. On the flip side, if the price spikes and then closes lower than the opening price, it could be a sign to sell before the price drops further.
Lastly, OHLC data is great for understanding market volatility—how much the price is bouncing up and down.
In short, OHLC data provides a well-rounded view of how an asset’s price is behaving, helping traders make smarter decisions when it comes to buying, selling, or holding.
Accessing OHLC Data in Python
OHLC data is typically provided by trading exchanges, but you can also access it through various third-party services. For U.S. stock data, you can use platforms like Yahoo Finance, Alpha Vantage, IEX Cloud, Interactive Brokers, and Quandl. Cryptocurrency data can be obtained from sources such as Coinbase, Binance, ByBit, and others. Forex data is available through OANDA, Quandl, Finnhub, and similar services. For commodity data, Quandl, MarketWatch, and the U.S. Energy Information Administration (EIA) are good options. These services offer both historical and real-time OHLC data to meet your needs.
We will use various libraries for different purposes, with yfinance being a common choice for accessing stock data, though it’s not the only option. Below is a code snippet demonstrating how to use the yfinance library to retrieve one year of data for Microsoft (MSFT):
import yfinance as yf

# Define the stock symbol for Microsoft
symbol = 'MSFT'

# Fetch historical OHLC data for Microsoft
data = yf.download(symbol, start='2023-01-01', end='2024-01-01')

# Display the first few rows of the data
print(data.head())
If you run this code you will see the following:
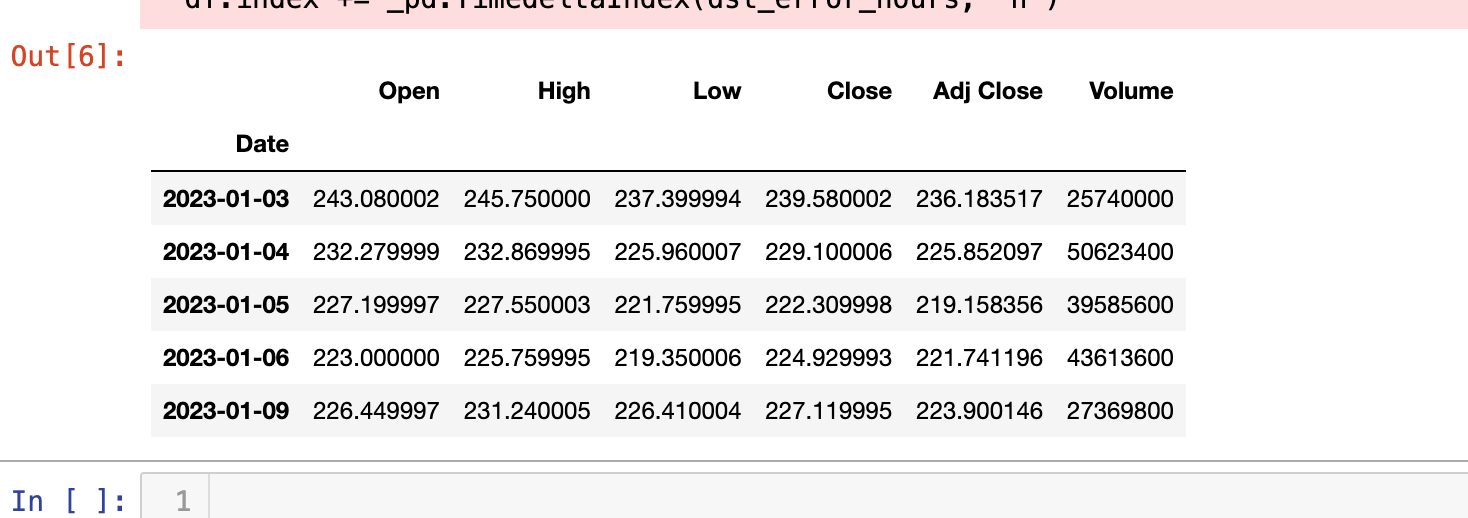
In technical analysis, the columns Date, Open, High, Low, Close, and Volume are commonly used. Among these, Date, Close, and Volume are particularly important, as they are frequently utilized in various technical indicators and analysis techniques.
Conclusion
I hope after reading this post, you now have a better idea of what’s coming next. Understanding OHLC data is crucial because it forms the foundation of technical analysis. Without it, analyzing price movements and making informed trading decisions would be much more difficult.