This post is part of the T4p Series.
In the previous post, I introduced you to Candlestick patterns, explaining what they are and discussing a couple of well-known patterns and their implementation in Python. We will be discussing further famous patterns in coming posts but here we will learn how you can come up with your own candlestick patterns and implement them in Python. Ultimately, we will be using our custom and awesome candlestick pattern to generate signals and print money.

Custom Pattern
So, what would that custom pattern be? Pretty simple:
- Bullish: If 3 consecutive candles are green, it triggers a SELL signal.
- Bearish: If 3 consecutive candles are red, it triggers a BUY signal (Buy the dip!).
Alright, now that we’ve created our revolutionary pattern, it’s time to automate it. Let’s dive in!
Development
Visualization
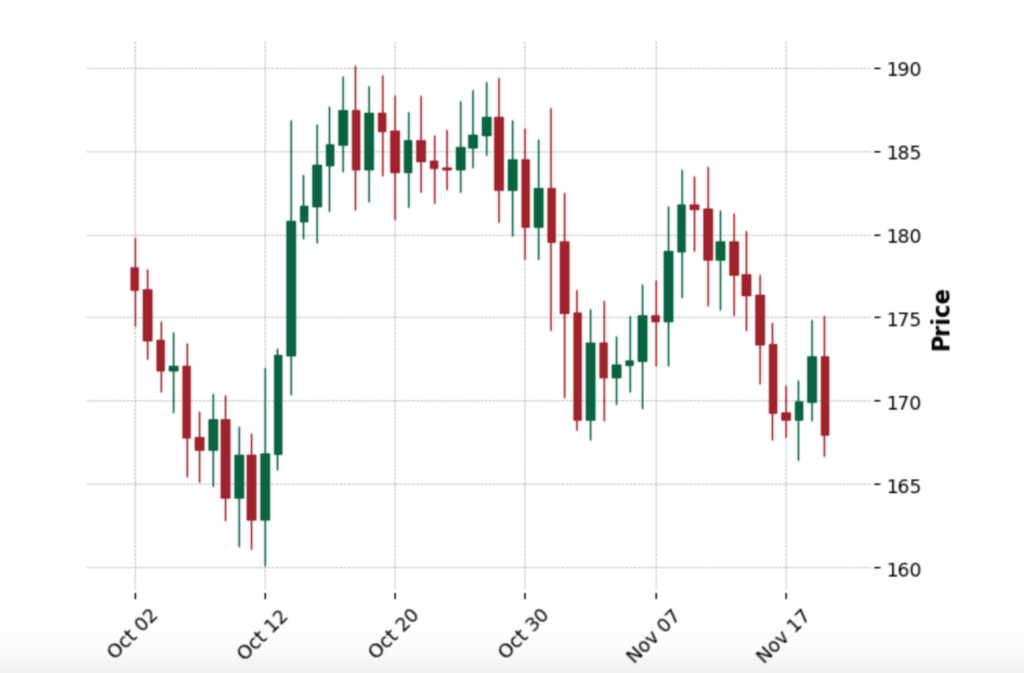
Like always, the first step is to visualize the candlestick data. used ChatGPT to generate fictitious OHLC data tailored to my requirements. Calling generate_signals function produced the following output:
Our pattern generates bearish or bullish signals if there are 3 consecutive green or red candles, respectively. In the chart above, the first red candle appeared on 2nd October, and the 3rd consecutive red candle appeared on 4th October, triggering a BUY signal. Similarly, the 3rd consecutive green candle appeared on the 14th and 16th of October, triggering a SELL signal. Below is the code that generates these signals:
def generate_signals(df):
    signals = []
    dates = []  # To store proper dates

    # Ensure the Date column or index is in datetime format
    if not isinstance(df.index, pd.DatetimeIndex):
        df.index = pd.to_datetime(df.index)

    for i in range(len(df)):
        if i >= 2:  # Start checking from the 3rd row
            # Check for 3 consecutive green candles -> Generate SELL signal
            if (
                df.iloc[i-2]["Close"] > df.iloc[i-2]["Open"] and
                df.iloc[i-1]["Close"] > df.iloc[i-1]["Open"] and
                df.iloc[i]["Close"] > df.iloc[i]["Open"]
            ):
                signals.append("SELL")
                dates.append(df.index[i])  # Add the proper date
                continue

            # Check for 3 consecutive red candles -> Generate BUY signal
            if (
                df.iloc[i-2]["Close"] < df.iloc[i-2]["Open"] and
                df.iloc[i-1]["Close"] < df.iloc[i-1]["Open"] and
                df.iloc[i]["Close"] < df.iloc[i]["Open"]
            ):
                signals.append("BUY")
                dates.append(df.index[i])  # Add the proper date
                continue

        # Default to NEUTRAL if no pattern detected
        signals.append("NEUTRAL")
        dates.append(df.index[i])  # Add the proper date

    # Add padding for the first two rows (no signals there)
    signals = ["NEUTRAL", "NEUTRAL"] + signals
    dates = list(df.index[:2]) + dates  # Ensure the dates align

    return pd.DataFrame({"Date": dates[:len(df)], "Signal": signals[:len(df)]})
And when you run it, it produces the following output:
Sweet, No?
Conclusion
Now you’ve learned how to easily automate your own favorite and secret patterns in Python and generate signals. Typically, traders rely on well-known patterns, which we will discuss in future posts. As always, the notebook and relevant data have been uploaded to GitHub.


